

.jpg "Hyperliquid (HYPE), Zcash (ZEC), Ethereum (ETH) and Shiba Inu (SHIB) Price Analysis for September 9: Volatility Implosion Introduces New Implications – U.Today")
- Hyperliquid (HYPE): HYPE remains bullish despite cooling from $89, with $78–$80 support key for another push toward $90 and potentially $100.
- Zcash (ZEC): ZEC’s powerful rally remains intact, but extreme overextension and overbought RSI make a correction toward $1,000 or even $850 possible.
- Ethereum (ETH): ETH is consolidating above key support after its August breakout, but a rally to $2,600–$2,650 seems unlikely.
- Shiba Inu (SHIB): SHIB’s recovery remains constructive, but reclaiming the 200-day moving average at $0.00000567 is necessary to stay bullish.
Hyperliquid might retreat
After one of its biggest rallies of the year, Hyperliquid is finally exhibiting some signs of weariness. After dropping about 3.2 percent during the day, HYPE is currently trading at $82.50, retreating from the most recent local peak near $89.
But the overall structure is still very bullish. In the latter part of August, HYPE surged from the $56–$60 range and then surpassed its prior significant highs at $75. The asset is still significantly above all of the daily chart’s major moving averages.
While the 50-day and 100-day averages are significantly lower at roughly $66.82 and $65.39, the 20-day moving average is close to $77.82. Nearly $57 is the 200-day average. Whether the current decline is indicative of normal cooling or the start of a more significant correction is the immediate question.
You Might Also Like

The former scenario is somewhat supported by the RSI. It moved into overbought territory before declining to about 57 points. As a result, momentum significantly returned to normal while the price corrected.
The crucial support zone is now between $78 and $80. It overlaps with the 20-day moving average, which is rising quickly, and the recent consolidation area. Holding it would put HYPE in a position to try again at $88–$90. A breakout there could open the path to the psychological $100 level.
Will Zcash’s uptrend stay up?
Zcash (ZEC) is still in an incredibly aggressive uptrend, but there is a much greater risk of a correction given its current technical configuration. After briefly rising above $1,240, ZEC is currently trading at about $1,149, continuing a rally that started in August at about $480. The price has significantly deviated from its main moving averages.
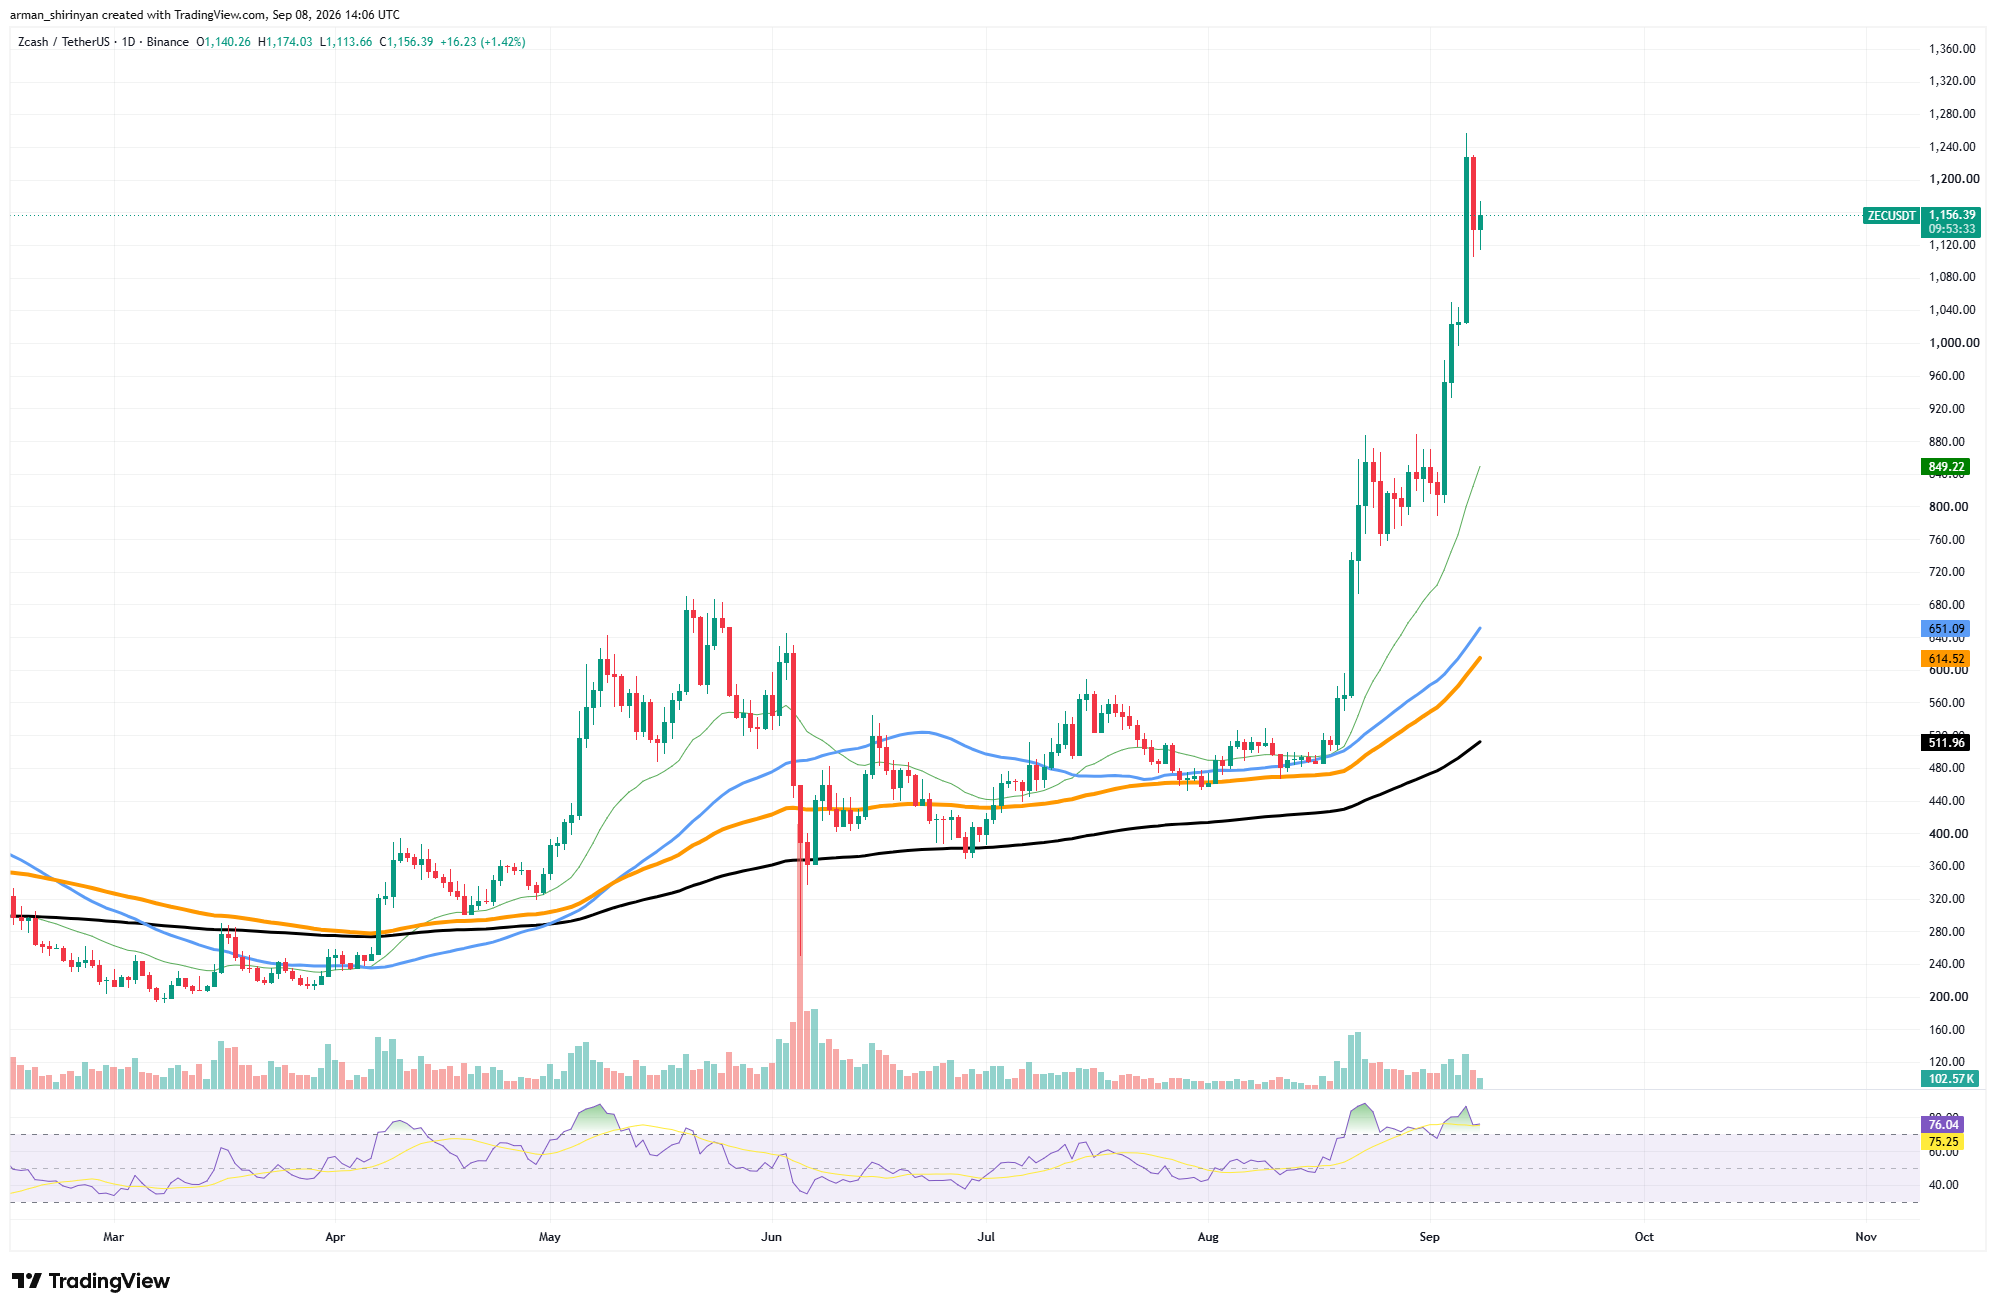
The 50-day and 100-day averages are still close to $651 and $614, respectively, while the 20-day average has already increased to about $849. At $512, the 200-day average is situated.
This separation shows how strong the trend is, but it also indicates that ZEC has very little technical support in the area if momentum abruptly stops. RSI is an additional caution. The daily reading is still in overbought territory, at about 75.8. In contrast to a traditional bearish signal, an overbought RSI does not always indicate that a strong trend will immediately reverse.
You Might Also Like

However, it does show that chasing ZEC around current levels is much riskier. The recent $1,230–$1,250 peak continues to be the first barrier. A strong breakout might move the market closer to $1,300 and possibly higher. The first area to watch on the downside is between $1,080 and $1,100. $1,000 becomes the primary psychological support below it.
The larger bullish structure would not necessarily be destroyed by a deeper correction toward $850, which would still keep ZEC above its quickly rising 20-day moving average.
Ethereum withstanding pressure
Ethereum is currently trading at about $2,459 as it consolidates following its explosive August breakout. The crucial point is that, despite multiple attempts to drive the asset below $2,400, sellers have not yet been able to undo the new market structure.
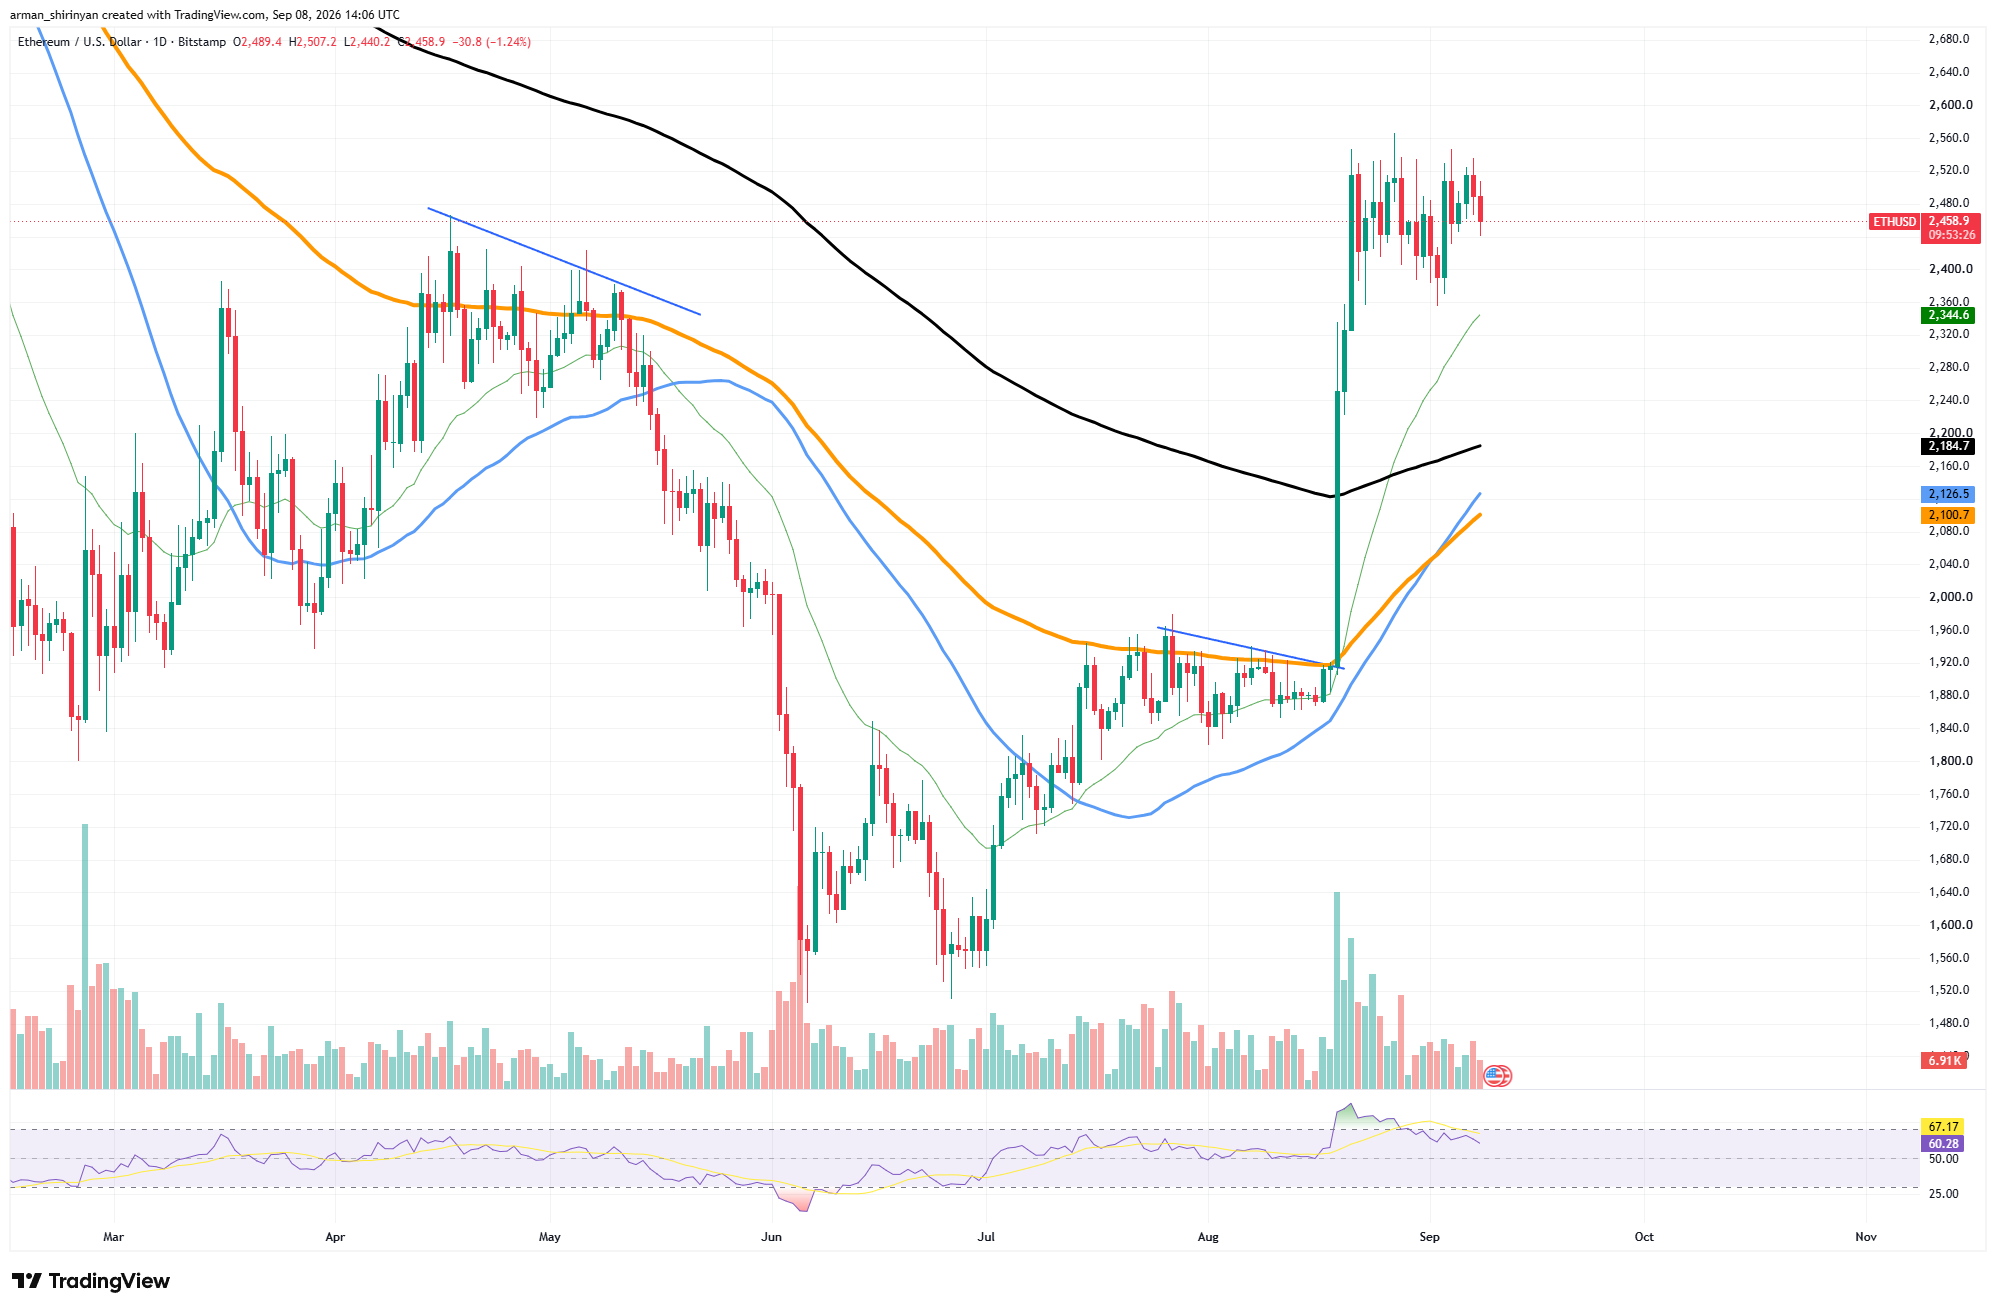
With remarkable momentum, ETH emerged from a protracted consolidation between $1,880 and $1,920, quickly surpassing all of its major moving averages. At about $2,345 and $2,185, respectively, it is currently trading well above the 20-day and 200-day averages. The 50-day and 100-day averages are still much lower, at about $2,127 and $2,101, respectively. There is no doubt, however, that momentum has decreased.
You Might Also Like

Trading volume has significantly decreased since the initial breakout, and the RSI has dropped to about 60 from overbought territory. Both developments show that the market has entered consolidation following an exceptionally quick repricing, so neither is inherently negative.
Between $2,520 and $2,560 is where the immediate resistance is located. ETH has tested this area on several occasions without yielding a strong daily breakout. Clearing $2,560 would probably put $2,600–$2,650 back on track. $2,400 remains the first significant support on the downside.
A breakdown would reveal the rising 20-day average around $2,345. The larger bullish structure is unaffected as long as that area holds.
Can SHIB keep up with the market?
Shiba Inu’s chart is still far less convincing than Ethereum’s, but it is still making progress. After setting a series of higher lows since its August bottom near $0.00000440, SHIB is currently trading around $0.00000541.
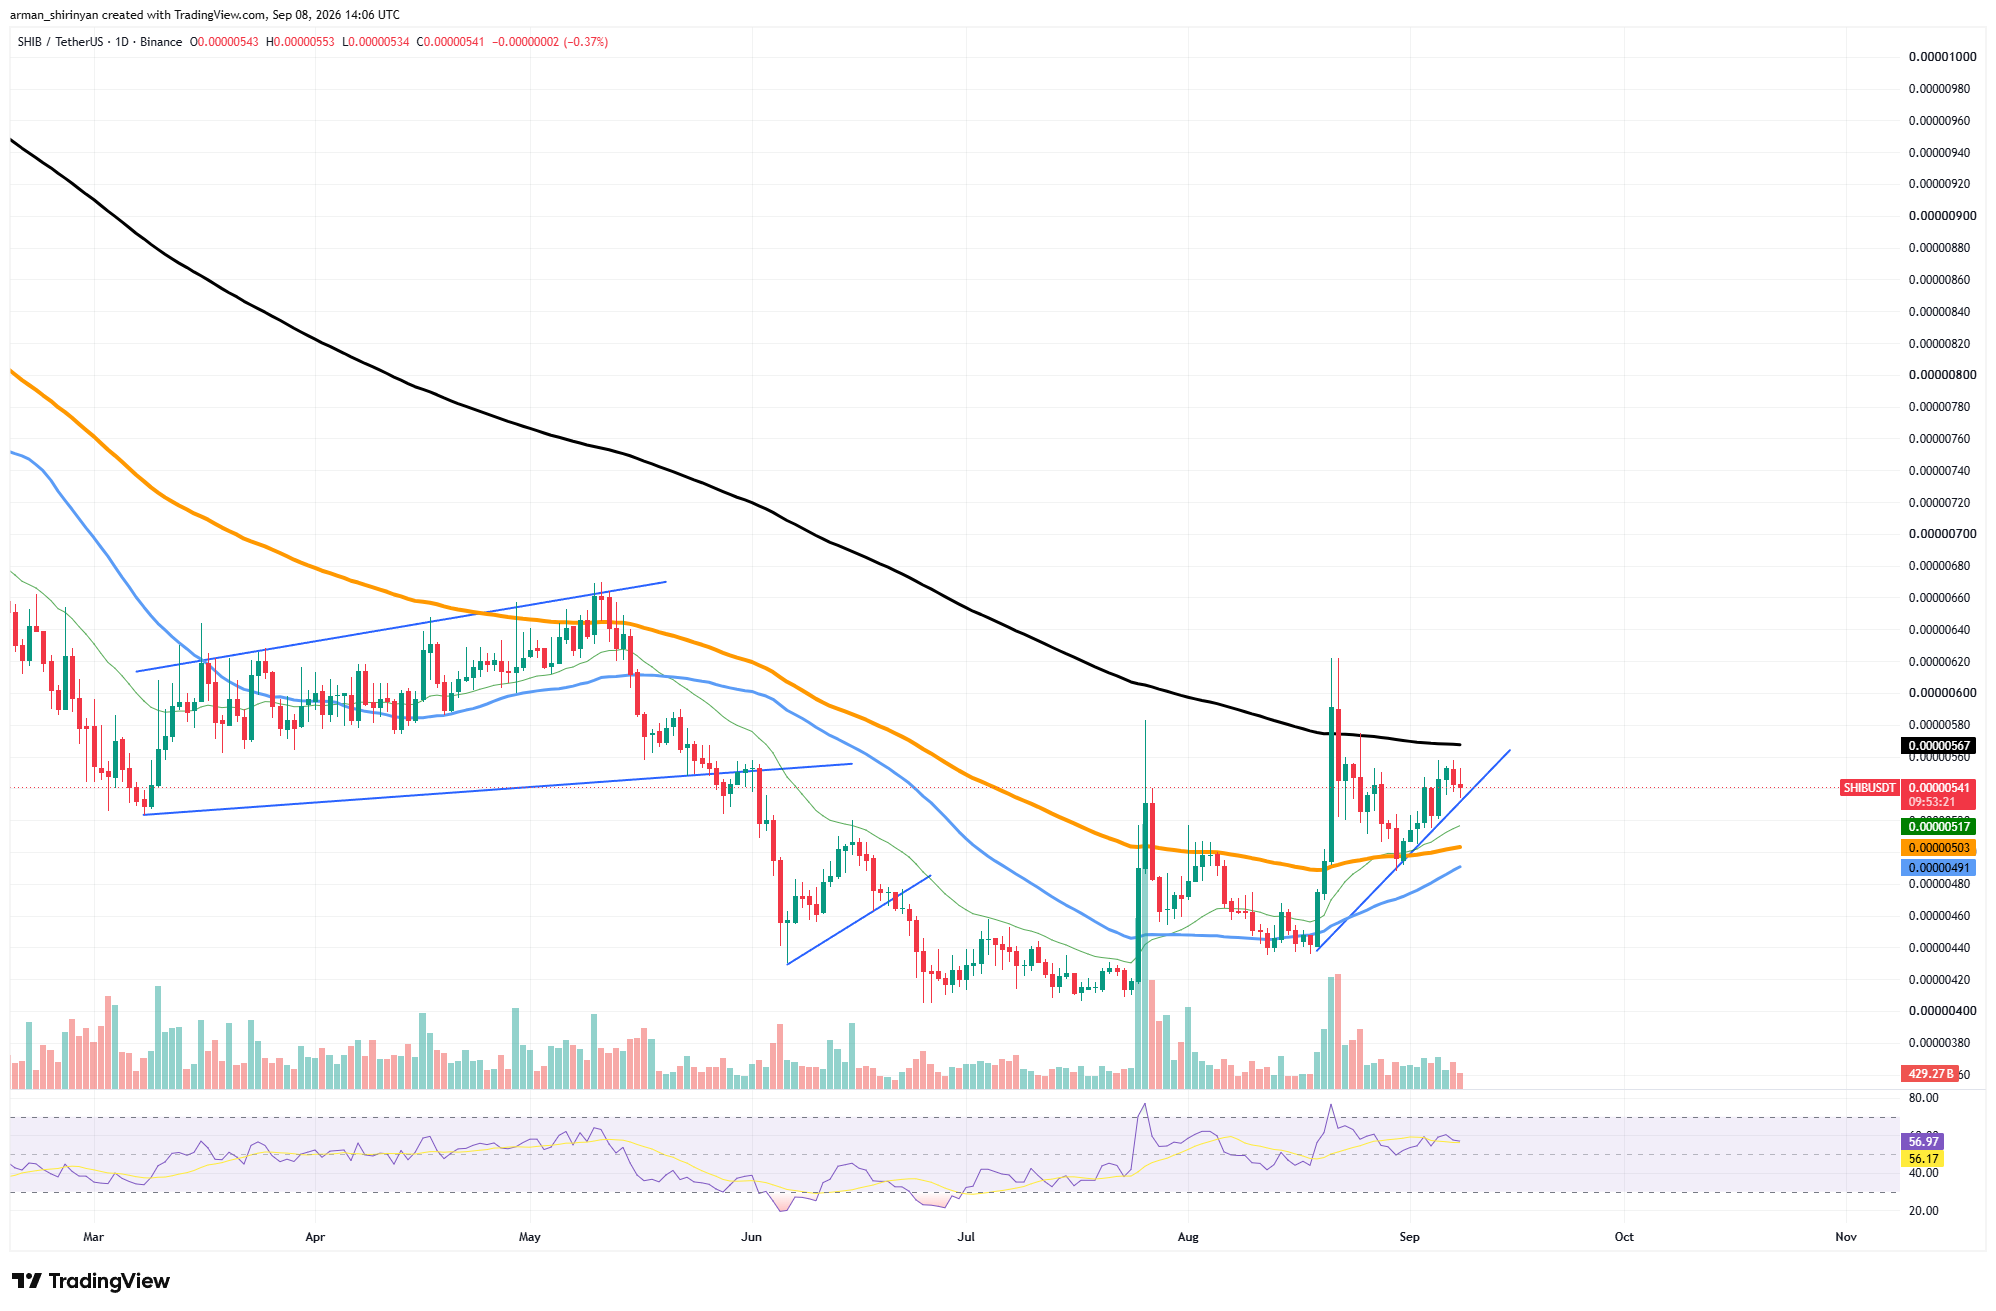
Buyers are favored by the short-term structure. While the 50-day and 100-day averages are close to $0.00000491 and $0.00000503, SHIB is still above its 20-day moving average at $0.00000517.
More significantly, the price still respects the rising support line that was established during the most recent rebound. The 200-day moving average at $0.00000567 remains the main barrier. Since SHIB has not returned to this level, there has not been a clear bullish reversal in the overall trend.
You Might Also Like

Aggressive selling also affected earlier attempts to move significantly above it. Momentum is neutral to positive. With an RSI of about 57, there is plenty of room before overbought conditions become problematic. The most recent advance, however, lacks the participation observed during SHIB’s earlier explosive moves, as evidenced by the declining volume.
A breakout above $0.00000567 could reopen $0.00000600–$0.00000620 and would be the most significant technical confirmation. On the other hand, the recovery would be weakened if the rising support and $0.00000517 were lost. The crucial defensive zone for buyers would then be the $0.00000490–$0.00000500 range.
.jpg&description=Hyperliquid+%28HYPE%29%2C+Zcash+%28ZEC%29%2C+Ethereum+%28ETH%29+and+Shiba+Inu+%28SHIB%29+Price+Analysis+for+September+9%3A+Volatility+Implosion+Introduces+New+Implications+%E2%80%93+U.Today)