

Key Takeaways
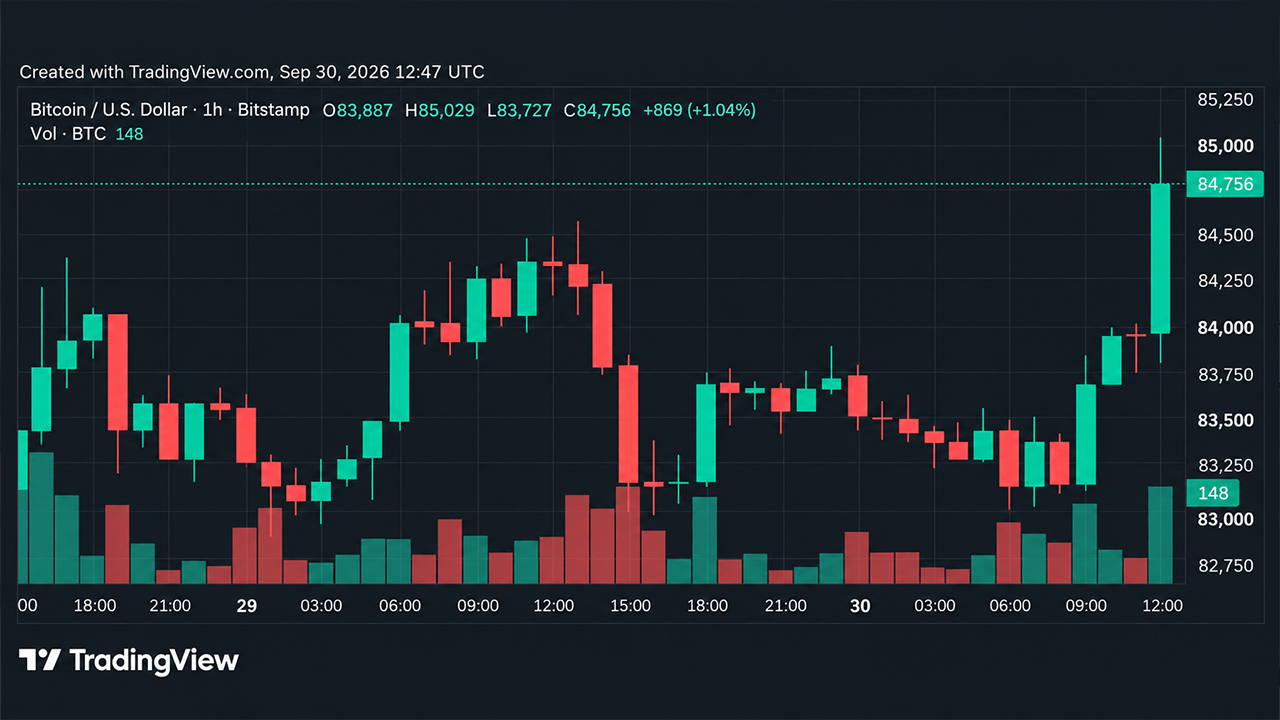
- Bitcoin’s price trades between $84,890 and $85,469 as bulls defend the $83,000 support zone.
- Bitcoin reclaiming $85,500 could reopen a path toward $86,200 and the recent $87,374. high
- Bitcoin losing $82,555 could shift momentum toward the $81,000-$82,000 zone.
Hourly Bitcoin Chart Keeps the Bounce Alive
On the 1-hour chart, bitcoin’s price rebounded from the Sept. 28 local low of $82,555 remains intact, with price holding just below $85,000 after the sharp Sept. 23-24 retreat from $87,272. The market spent Sept. 25-27 chopping between roughly $84,000 and $85,000 before slipping to that $82,555 floor.
Intraday support now rests at $82,555-$83,000, while nearby resistance stands at $85,500-$86,200. A sustained push through that ceiling would put the September highs near $87,300 back on the radar, while a loss of $82,555 would take the current bounce thesis off the table.
4-Hour Chart Shows Bitcoin Caught in a Box
The 4-hour chart tells a more cautious story after bitcoin’s powerful move from $74,913 around Sept. 16 to $87,374 around Sept. 22. Since touching that high, BTC has retreated into a mildly descending range spanning roughly $82,500 to $85,500, with the current price sitting in the lower half of that box.
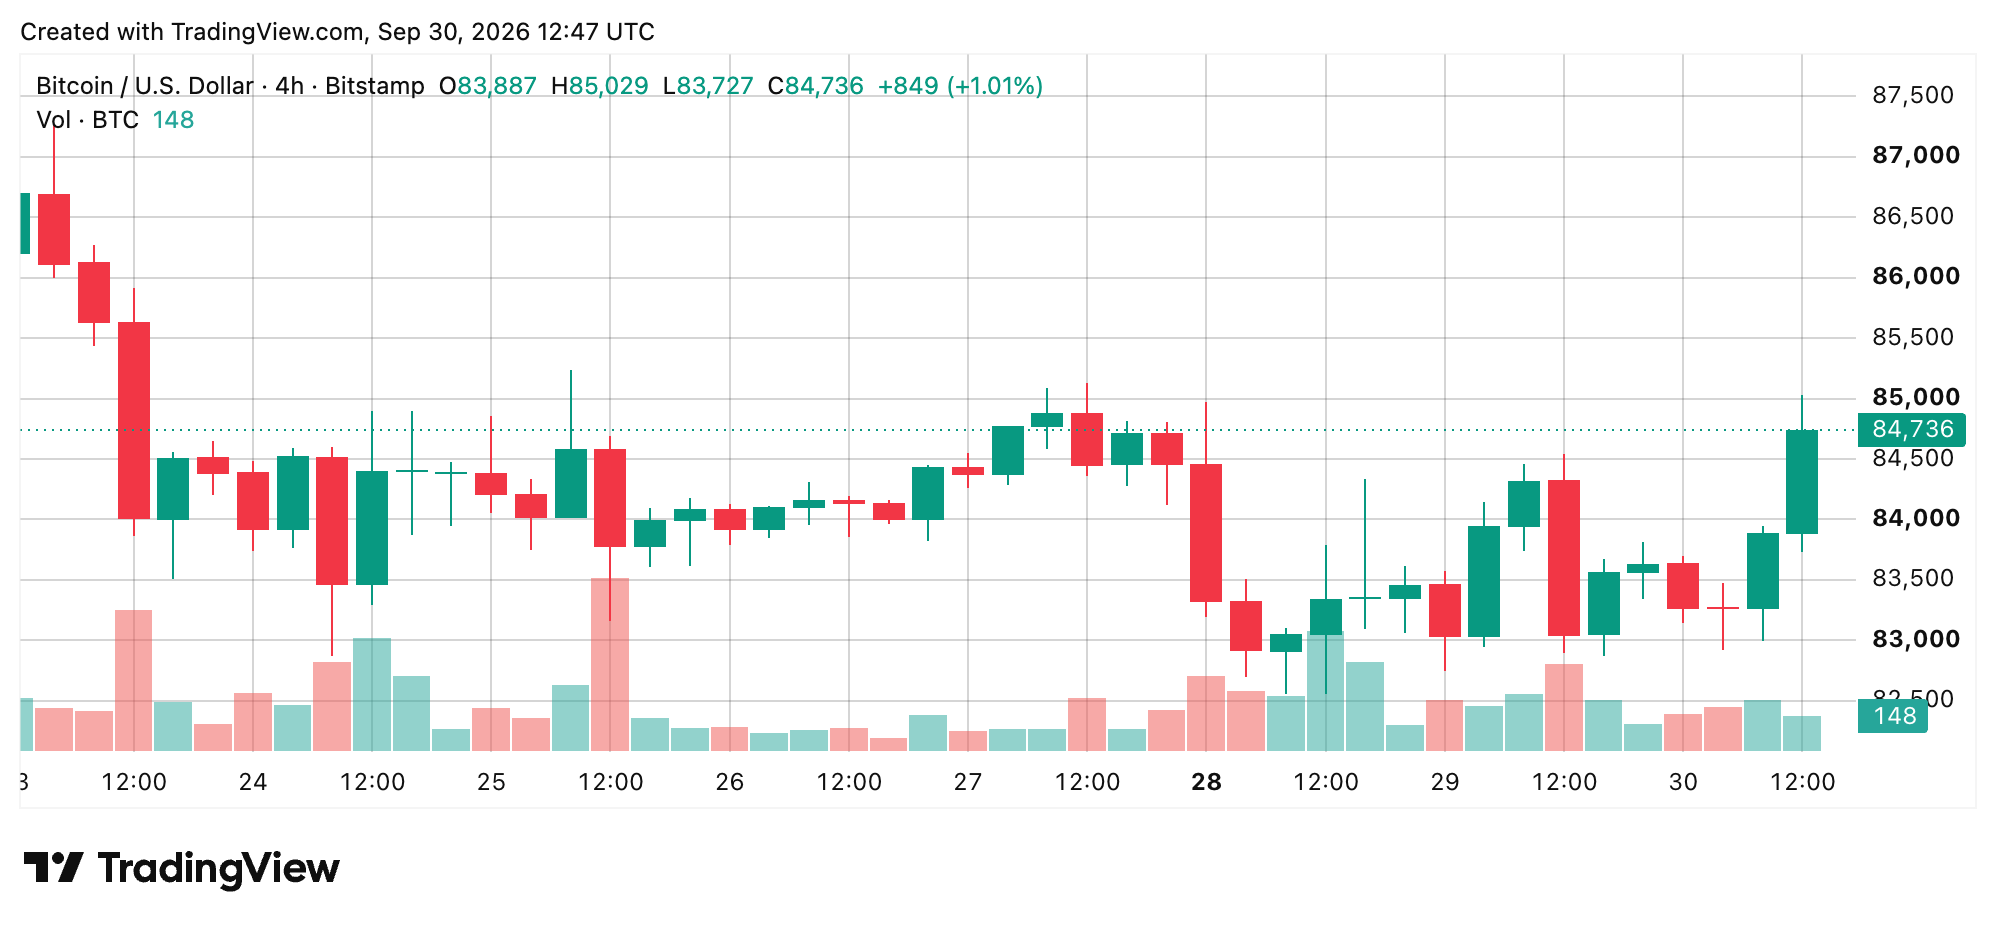
Bitstamp’s order-book depth showed bids clustered just below roughly 83,500-84,000, while offers were building from the mid-84,000s into the mid-$85,000s. A reclaim of $87,374 would break the post-spike consolidation, while losing $82,555 would expose the distant mid-to-high $74,000 area.
Daily Structure Still Favors the Larger Uptrend
Bitcoin’s daily chart remains constructive despite the failure to hold September’s $87,374 high. The broader advance began from the late-June low of $57,735, worked through a July-August base and eventually produced September’s run into the upper $87,000s.
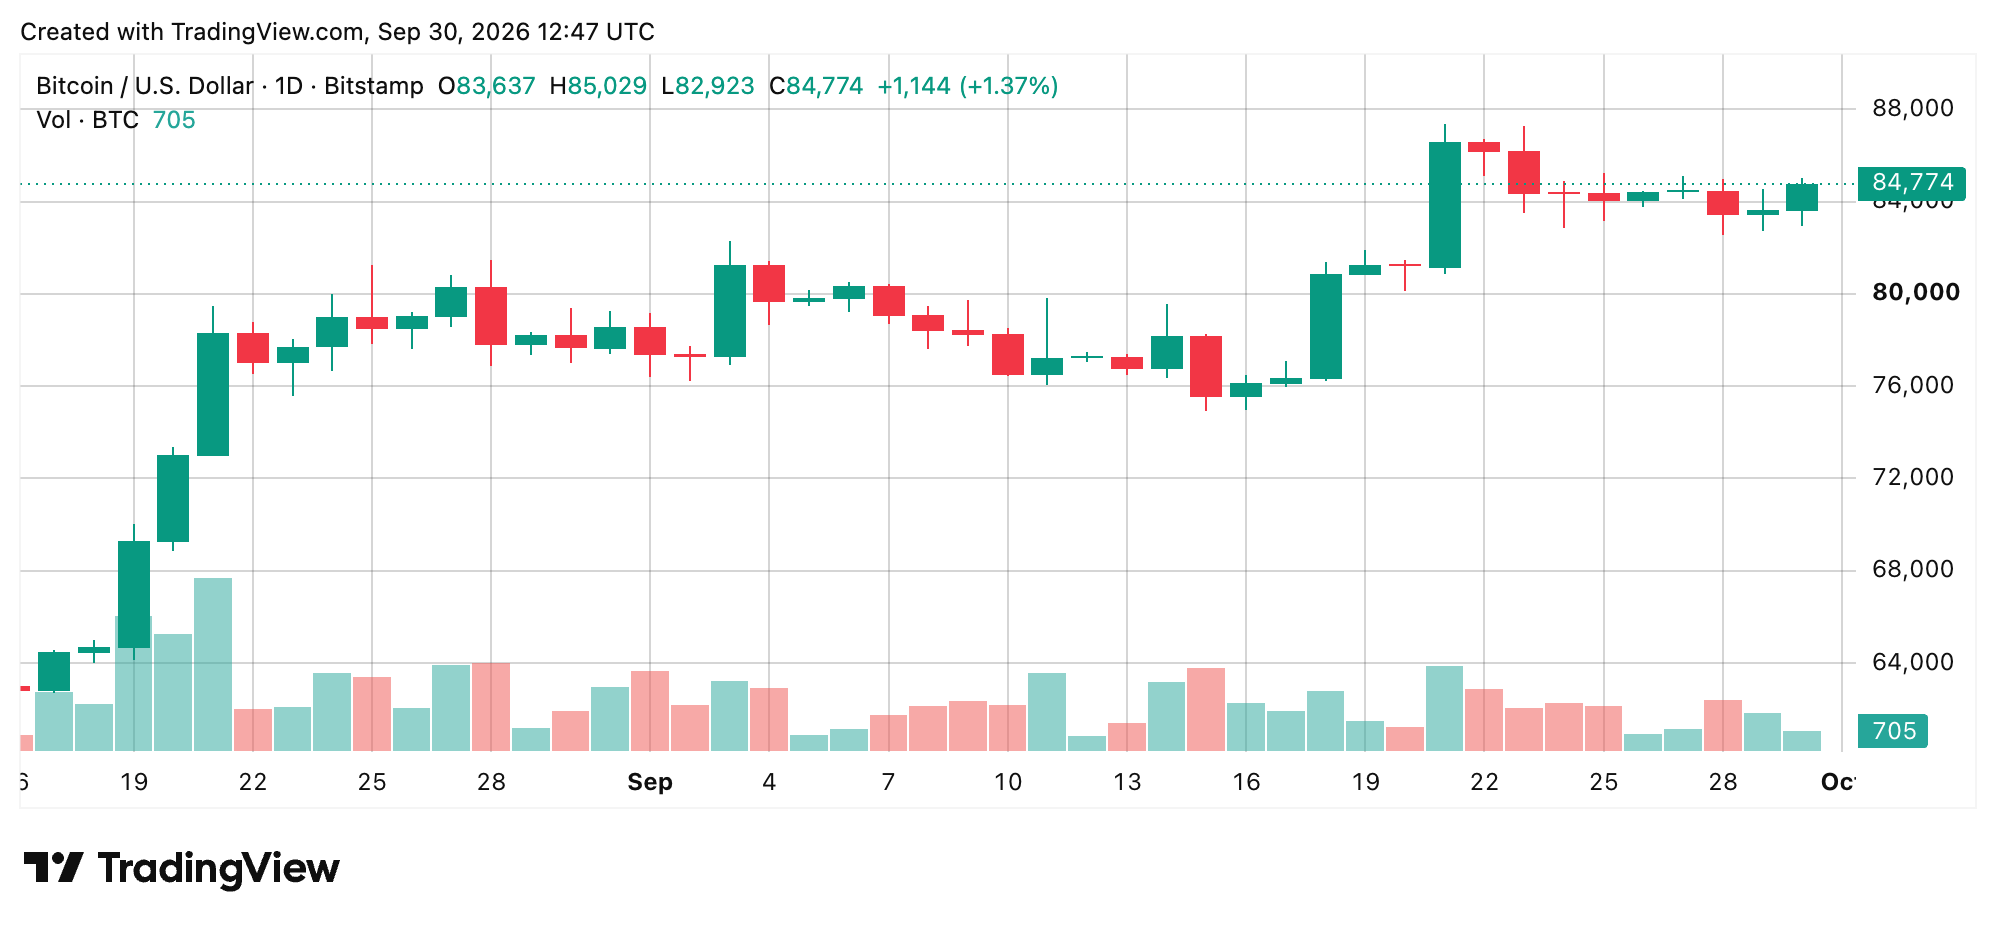
BTC has since settled into the 83,000-85,000 neighborhood, still comfortably above the June-August range and the mid-$70,000 breakout zone. Recent daily volume has also been lighter than during September’s expansion bars. The higher-low structure from the summer trough remains intact, although bulls have yet to reclaim the last impulse high.
Oscillators Refuse to Give Either Side a Clean Sweep
The daily chart’s oscillator board is decidedly mixed, carrying an overall neutral reading with one bearish, eight neutral, and two bullish signals. The relative strength index (RSI) stands at 61, while the Stochastic reads 69, the commodity channel index (CCI) sits at 47 and the average directional index (ADX) registers 41, all neutral.
The Awesome oscillator (AO) is neutral at 3,757, while momentum currently flashes positive at 2,531 and the bull bear power does the same at 687. The moving average convergence divergence (MACD) level, however, reads 2,082 with a negative signal. Stochastic RSI Fast is neutral on Wednesday at 48, williams percent range is neutral at minus 32, and the Ultimate oscillator (UO) is undecided as well at 58.
Moving Averages Keep Bulls in the Driver’s Seat
Moving averages (MAs) provide the clearest bullish argument, carrying a strong buy rating with 13 bullish signals, one neutral and one bearish reading. Bitcoin trades above the 10-, 20-, 30-, 50-, 100- and 200-period exponential moving averages (EMAs), valued at $83,416, $81,968, $80,463, $77,784, $74,279 and $74,417, respectively.
BTC also sits above the 20-, 30-, 50-, 100- and 200-period simple moving averages (SMAs) at $81,306, $80,476, $77,274, $70,296 and $71,265. The lone moving-average sell comes from the 10-period SMA at $84,531, a level sitting directly inside nearby resistance. The volume weighted moving average (VWMA) at $81,124 and hull moving average (HMA) at $83,475 both register bullish signals, while the Ichimoku baseline at $81,144 remains neutral.
Bull Verdict:
Bitcoin holding above $83,000 keeps bulls in the fight, with a break above $84,500 opening the door to $85,200 and potentially another crack at $87,374.
Bear Verdict:
A break below $83,000 would put the recovery on shaky ground, while losing $82,555 could send bitcoin toward the $81,000-$82,000 support zone.
