

Bitcoin (BTC) traded below $70,000 for the first time in two months on Tuesday as sellers stayed in control.
Key points:
- Bitcoin drops under $70,000 to new two-month lows.
- Analysis sees 200-day trend lines coming back into play as bulls fail to rescue BTC price action.
- Stocks continue to post record highs while crypto stays bearish on US-Iran events.
BTC price analysis warns of “bearadise” as support thins
Data from TradingView showed new BTC price lows of $69,631 on Bitstamp.
After failing to follow stock markets higher, BTC/USD increased its divergence from other risk assets to fall by nearly 2% on the day.
BTC/USD one-hour chart. Source: Cointelegraph/TradingView
Crypto long positions paid the price, with total 24-hour liquidations on Bitcoin and altcoins nearing $800 million at the time of writing, per data from CoinGlass.
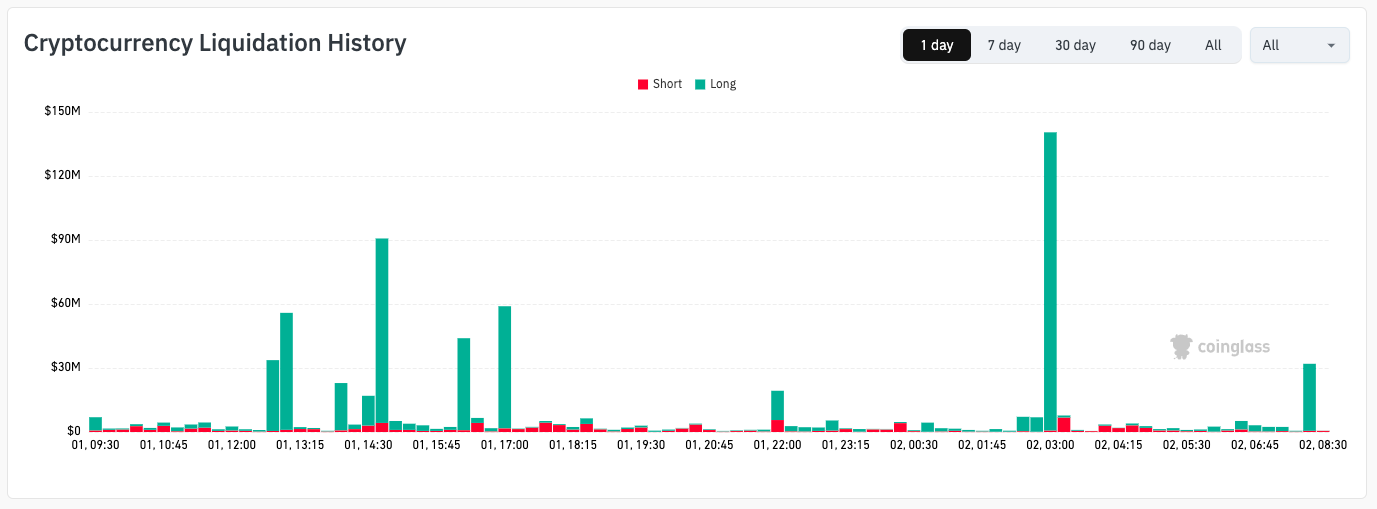
Crypto liquidation history (screenshot). Source: CoinGlass
“The pressure is building,” trader Ardi responded to the latest price moves in a post on X.
“We’ve seen BTC lose multiple key support levels in the space of 24 hours, and is now breaking below an already steep downward channel.”
Ardi described the loss of $72,500 as “key.”
“Once support starts breaking across multiple timeframes, the market usually starts moving toward the next major liquidity pivot. For me, that sits around $68.7K,” he continued.
“Unless BTC can reclaim this breakdown quickly, I think we’ll be heading there shortly.”
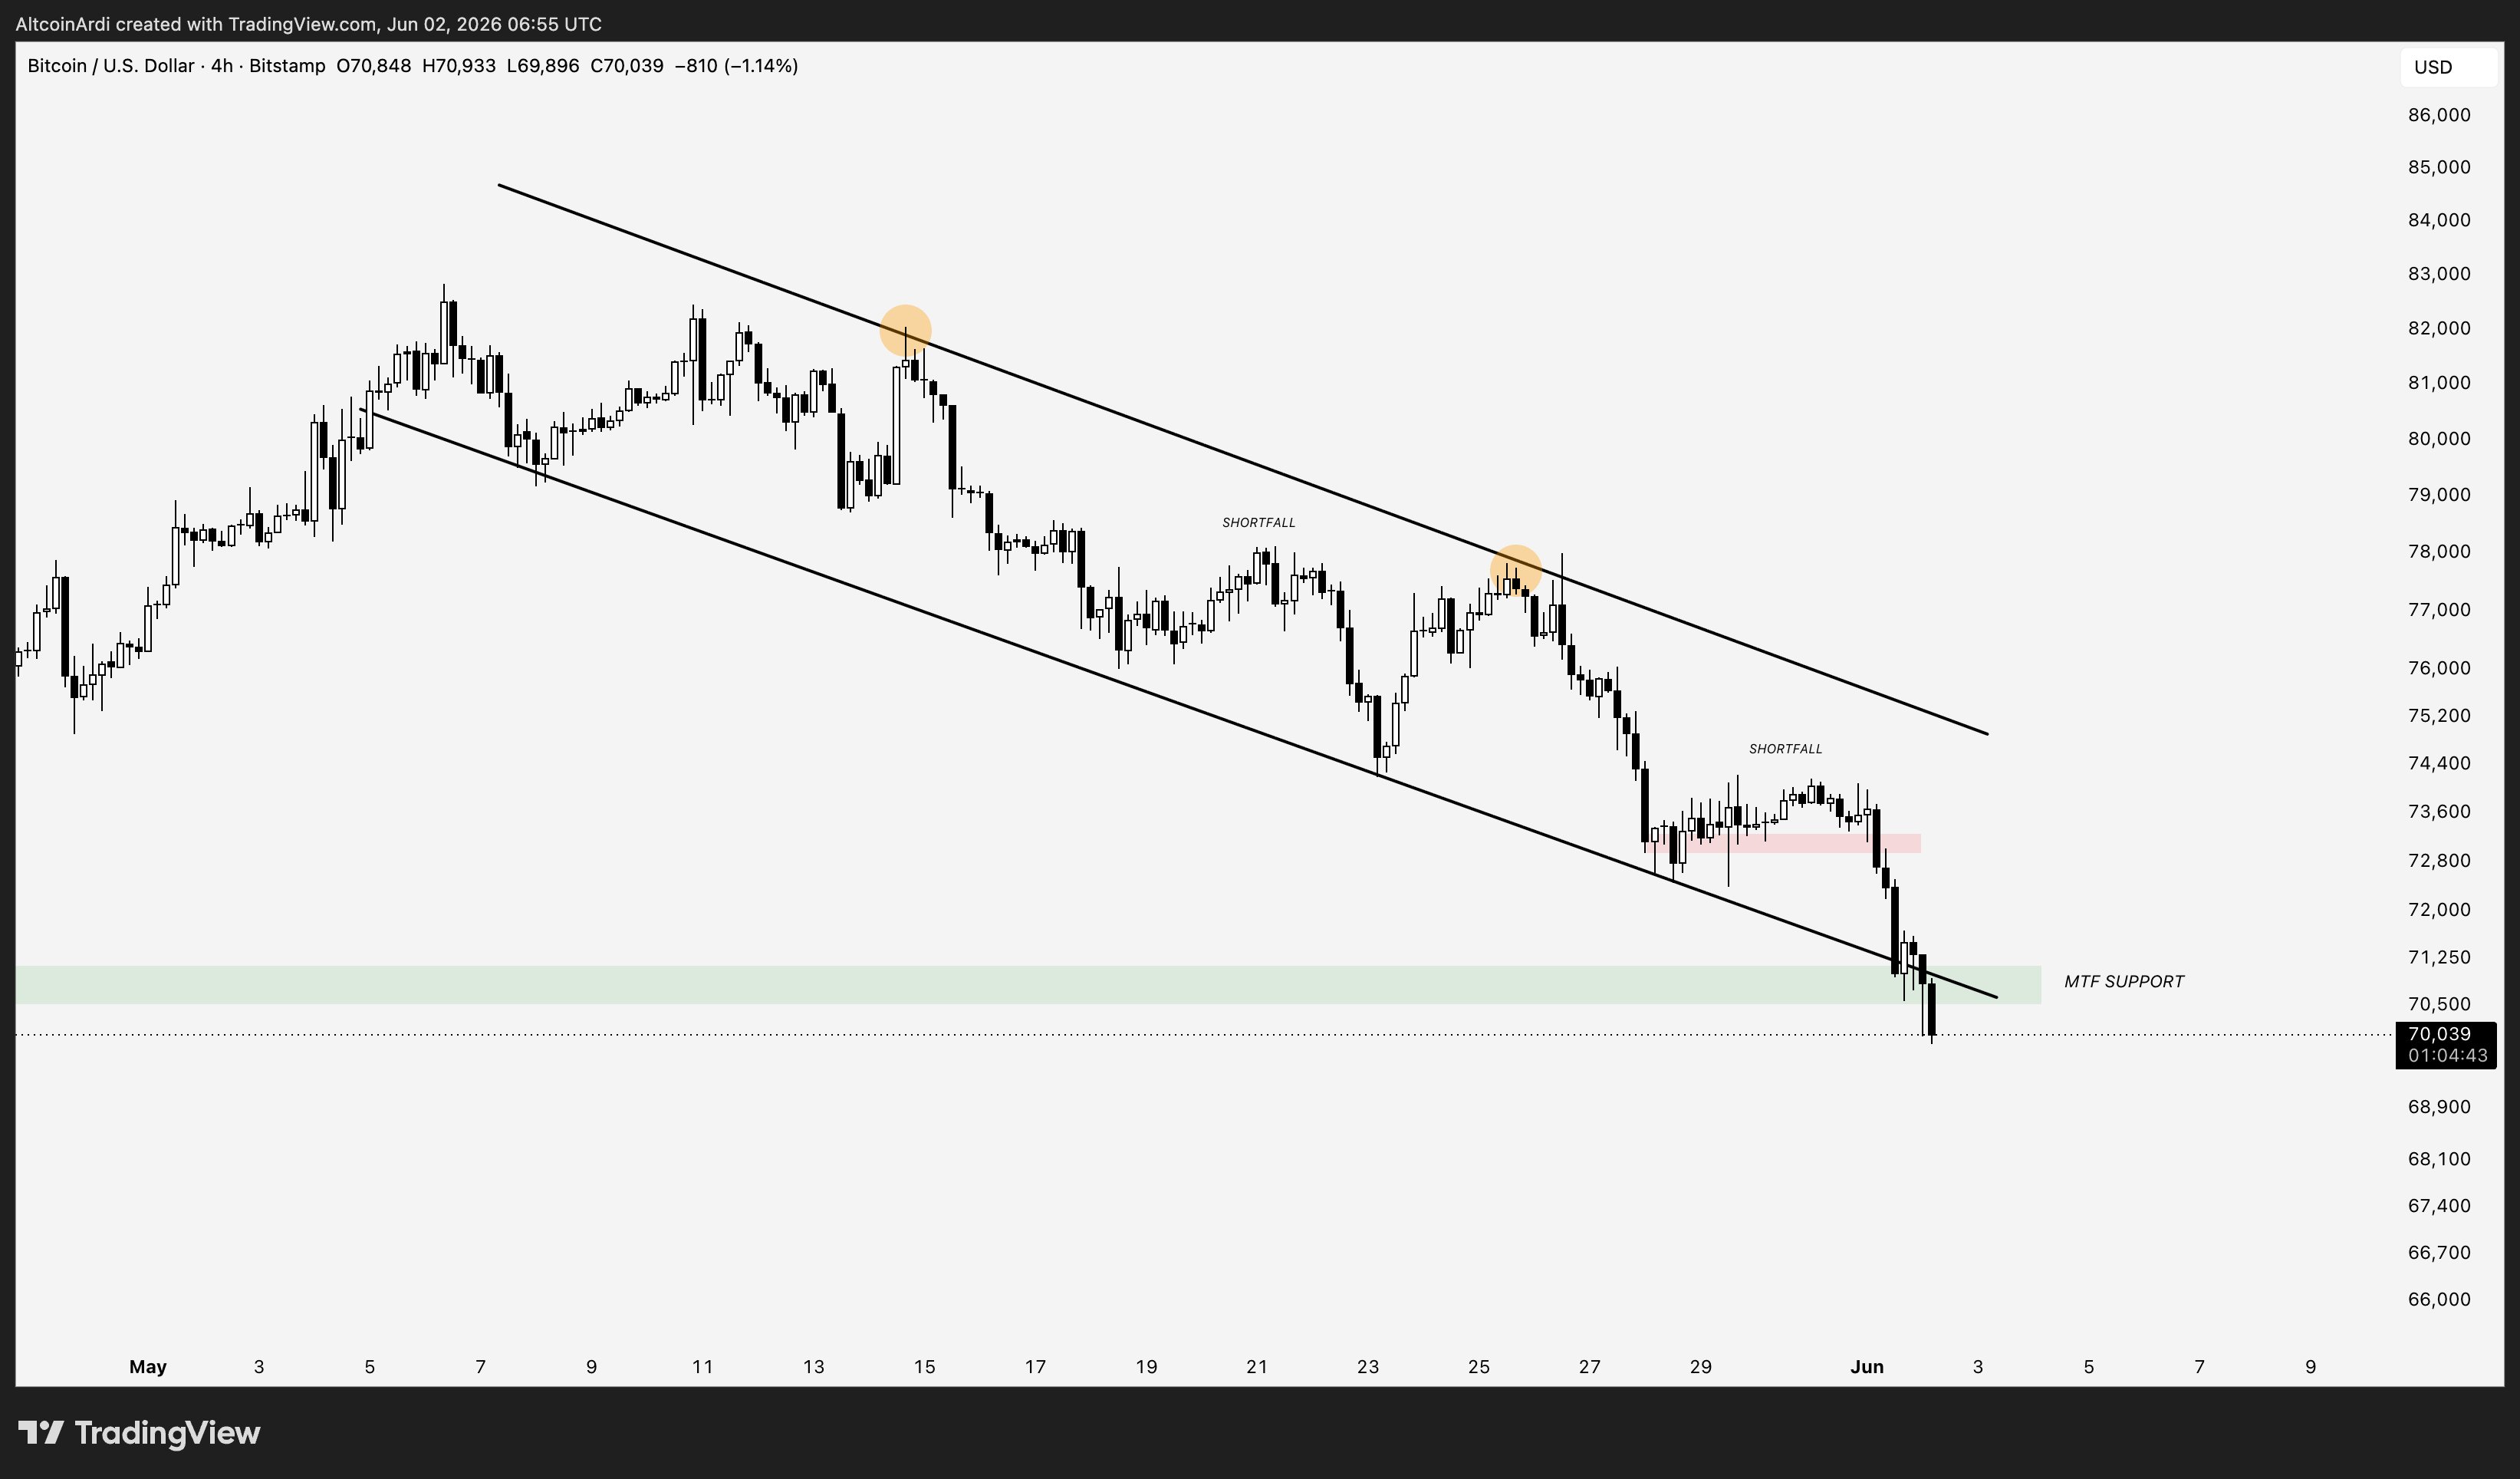
BTC/USD one-day chart. Source: Ardi/X
On Monday, trading resource Material Indicators flagged concerning signals from one of its proprietary trading tools.
“We still need to watch levels to determine if this is going to develop into a base building consolidation, or the next leg down,” it told X followers.
“The fact that price just fell through another Timescape level is another sign of weakness. The real test comes at the Q2 2026 Timescapes in the $68k – $69k range.”
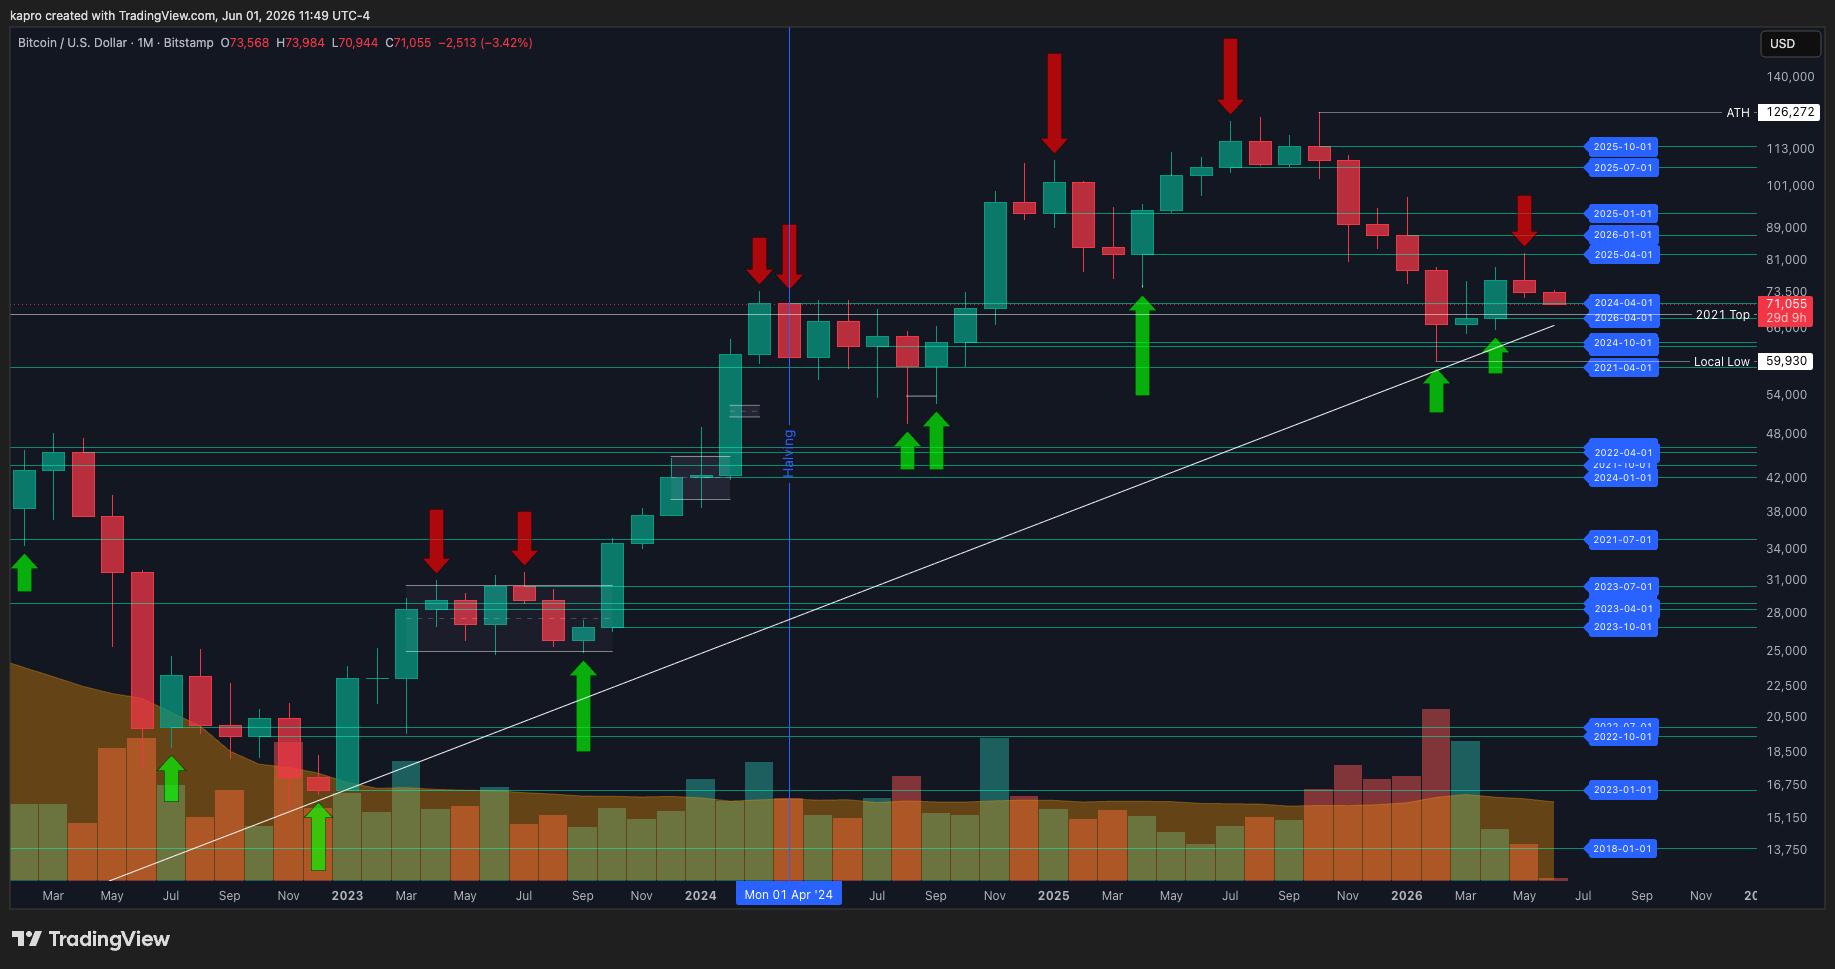
BTC/USD one-month chart. Source: Material Indicators/X
Material Indicators added that continued downside could bring the 200-day simple moving average into play.
“If bulls lose that range – pack your bags for Bearadise,” it added.
Stocks surge while crypto discounts Iran peace
Bitcoin faced multiple headwinds, including uncertainty over the US-Iran ceasefire deal, which on Monday appeared unlikely to succeed.
Related: Trump says Iran will ‘work out well’: Five things to know in Bitcoin this week
US President Donald Trump then revealed that talks were “continuing, at a rapid pace” between both sides.
The S&P 500 posted a fresh all-time high before cooling after passing 7,600 points for the first time.
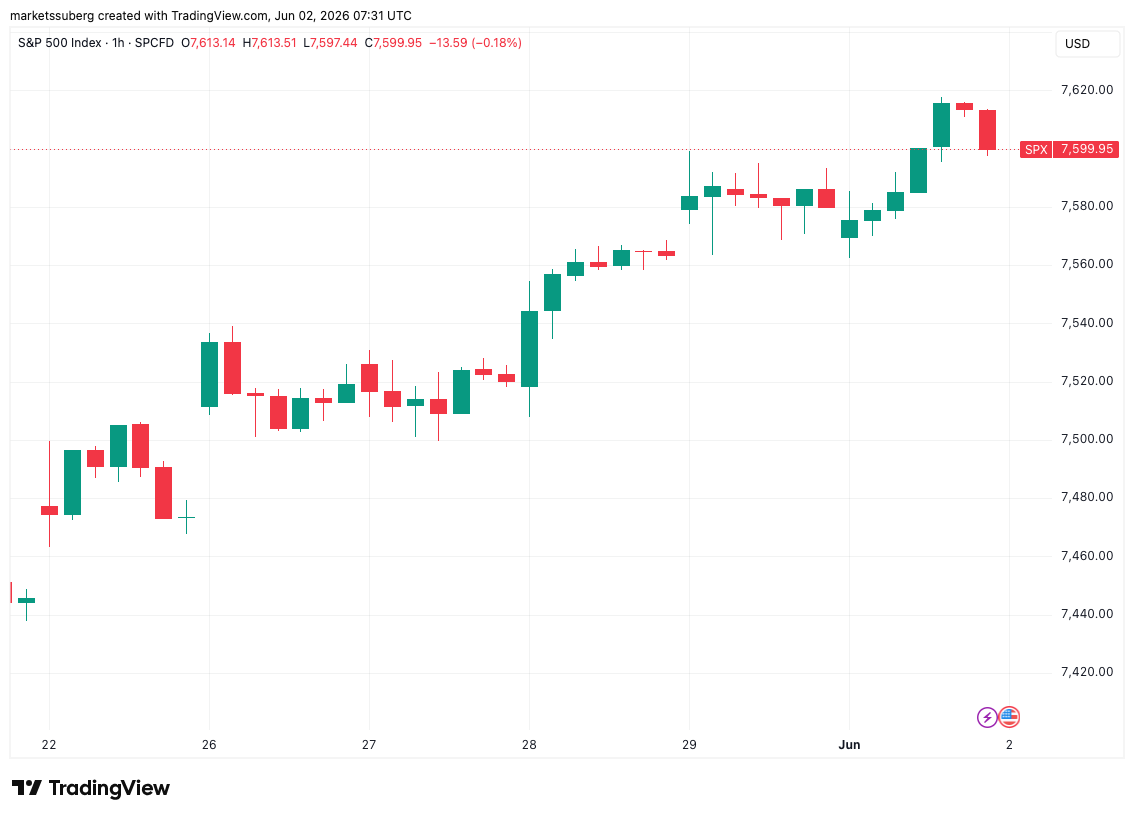
S&P 500 one-hour chart. Source: Cointelegraph/TradingView
Commenting, trading resource The Kobeissi Letter noted that the index could see its first 10 straight weeks of gains since 1985.
“That’s +$11.7 TRILLION in market cap since March 30th” it added about current upside.