

Uniswap (UNI) continues to show signs of renewed momentum, supported by a classic breakout setup and healthy capital inflows.
The token has maintained a consistent upward trajectory after forming a falling wedge, a historically bullish reversal pattern.
At the time of writing, UNI is trading at $10.73, reflecting a steady trend despite a minor -0.44% intraday loss. Market structure and volume dynamics suggest that bullish continuation toward the $13.00 level remains on the table.
Falling Wedge Breakout Highlights Reversal Potential
On the 1-hour timeframe, Uniswap has been trading within a falling wedge—a technical formation characterized by two downward-sloping, converging trendlines. Analyst @CryptoJoeReal shared a chart illustrating this pattern, noting that UNI bounced off the lower wedge boundary before moving upward.
The breakout target from this pattern is projected near $11.83, based on the vertical height of the wedge from its widest point, providing a potential 12% upside from current levels.
Source: X
Volume indicators support the technical case. As UNI approached the apex of the wedge, volume began to rise, with a clear shift from red to green bars on the hourly chart. This increasing demand suggests buyers are positioning ahead of a breakout.
Price action has now stabilized above the $10.50 level, and a close above $11.00 could confirm the breakout and activate upward targets toward $11.40 and $11.83.
Intraday Momentum and Volume Activity Support Bullish Case
Over the past 24 hours, UNI has posted a modest +0.28% gain, with the price reaching a high near $10.75 after bouncing from a session low of approximately $10.20. This intraday price structure reflects a bullish sequence of higher lows and higher highs, aligning with signals from technical patterns on shorter timeframes. The continued upward bias suggests growing investor interest as market sentiment improves.
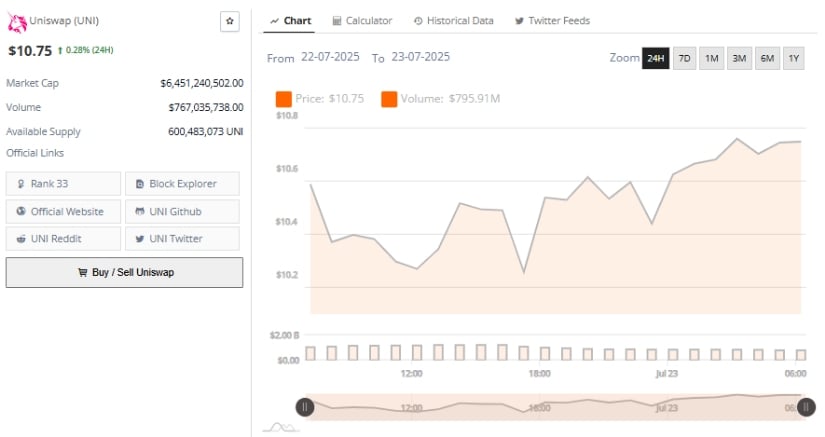
Source: BraveNewCoin
Uniswap’s 24-hour trading volume rose to $795.91 million, up slightly from the previous session’s $767 million. This steady volume growth signals strong market participation and reinforces the bullish price movement.
With a market capitalization of $6.45 billion and a circulating supply of 600.48 million UNI, the token holds the #33 spot in the global crypto rankings. Sustained price action above $10.50, supported by rising volume, may pave the way for a challenge of the $11.80 resistance area, especially if broader DeFi sentiment remains positive.
Technical Indicators Confirm Ongoing Uptrend
On the daily chart, UNI maintains a bullish structure that began in mid-June, having reached a local high of $12.83 during the current rally. Despite a small pullback, the broader trend remains intact. Support around the $10.50–$10.30 region appears firm, and a move above $11.00 would strengthen the case for a continuation toward prior highs.
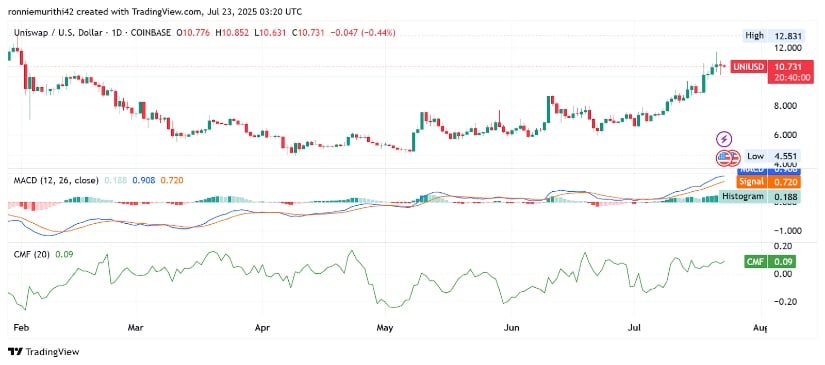
Source: TradingView
Momentum indicators remain in bullish territory. The MACD (12, 26) shows the MACD line at 0.908, positioned above the signal line at 0.720, with a histogram reading of 0.188. This setup reflects sustained upward momentum, though narrowing histogram bars suggest some short-term caution.
Meanwhile, the Chaikin Money Flow (CMF) stands at +0.09, confirming ongoing capital inflow. A rise in CMF alongside a renewed expansion in MACD histogram bars could validate the next leg higher.
If volume remains elevated and price sustains above key support, UNI may soon retest the $12.80 high, with further upside potential toward $13.00 in the coming sessions.