

After a steady period of consolidation, Optimism (OP) has pushed beyond key resistance at $0.70, triggering renewed interest among market participants.
Supported by strong technical formations and growing momentum, this breakout positions OP for potential upward continuation. Analysts are now closely tracking structural trends and on-chain metrics to evaluate whether the Layer 2 token can sustain its gains.
As of July 15, 2025, OP trades around $0.70, and technical indicators point to a possible expansion toward the $0.80 mark.
Inverse Head and Shoulders Confirms Breakout Structure
On the 1-hour chart, the OP/USDT pair confirmed an Inverse Head and Shoulders formation, often seen as a bullish reversal setup. The pattern, identified by chart analyst Crypto Joe (@CryptoJoeReal), displayed a clearly defined left shoulder, head, and right shoulder, followed by a neckline breakout.
Price surged once it cleared the neckline, supported by rising trading volume, hitting the projected target near $0.66. This technical confirmation provided early momentum for the current upward trend.
Source: X
Following the breakout, OP successfully reclaimed its 50-period moving average, a key dynamic indicator often used to verify trend changes. With the neckline now acting as support, traders observed the structure’s completion as a signal for further price movement.
The alignment of volume surge with the price breakout lent additional strength to the reversal thesis, validating the shift from prior bearish pressure to potential bullish continuation.
Market Activity, Liquidity, and Fundamental Positioning
Additionally, the latest data shows OP is trading at $0.70 with a 24-hour decline of -0.86%. Despite the minor retracement, the token remains structurally intact after reclaiming the $0.68–$0.70 resistance band.
With a market capitalization of $1.22 billion, OP ranks #98 globally, maintaining a mid-cap status within the broader cryptocurrency market. Daily trading volume of $435 million suggests sustained interest, with liquidity levels supporting active position entries and exits.

Source: BraveNewCoin
The circulating supply of approximately 1.75 billion OP tokens supports a relatively moderate inflation outlook. Optimism continues to play a pivotal role in Ethereum’s Layer 2 ecosystem, particularly in facilitating lower-cost transactions and scaling decentralized applications.
Broader adoption of Ethereum Layer 2 solutions contributes to ongoing demand for OP, especially as developers and users seek scalable alternatives amid rising network usage.
Technical Indicators Point to Short-Term Momentum Shift
At the time of writing, momentum indicators remain tilted in favor of bulls. The Relative Strength Index (RSI) stands at 65.71, just below the overbought threshold of 70. This level indicates solid buying strength without signaling exhaustion, suggesting the rally may still have room to extend. RSI has consistently moved above its midline in recent weeks, reflecting gradual accumulation and sustained upward pressure.
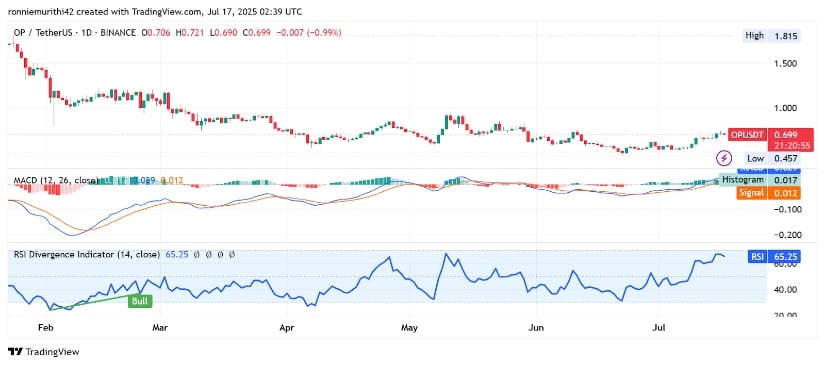
Source: TradingView
The Moving Average Convergence Divergence (MACD) shows a bullish crossover, with the MACD line trending above the signal line. The widening gap between the two lines and a positive histogram further reinforce the trend. This technical alignment, noted during a bullish engulfing pattern on the daily chart, supports a scenario where OP may advance toward the $0.80–$0.82 zone in the short term.

Source: X
Analysts like AltWolf (@AltwolfCrypto) have highlighted that OP’s price remains inside an upward channel, with higher lows supporting the trend structure. If the price continues to consolidate above $0.68 and broader market sentiment remains positive, OP could experience further expansion in the coming sessions.