

Glassnode data could imply Ethereum price dynamics are more influenced by derivatives and other off-chain markets compared to Bitcoin.
CBD Data Shows Divergence In Spot Activity For Bitcoin & Ethereum
In a new post on X, on-chain analytics firm Glassnode has talked about how the Cost Basis Distribution (CBD) has diverged between Bitcoin and Ethereum recently.
The CBD refers to an indicator that tells us about the amount of a given asset that addresses or investors on the network last purchased at each of the price levels visited by the cryptocurrency in its history.
This metric is useful because investors put special emphasis on their break-even level and tend to make some kind of move when a retest of it occurs. The more amount of the asset that the holders purchased at a particular level, the stronger is their reaction to a retest.
Now, first, here is a chart that shows the trend in the CBD for Bitcoin over the last few months:
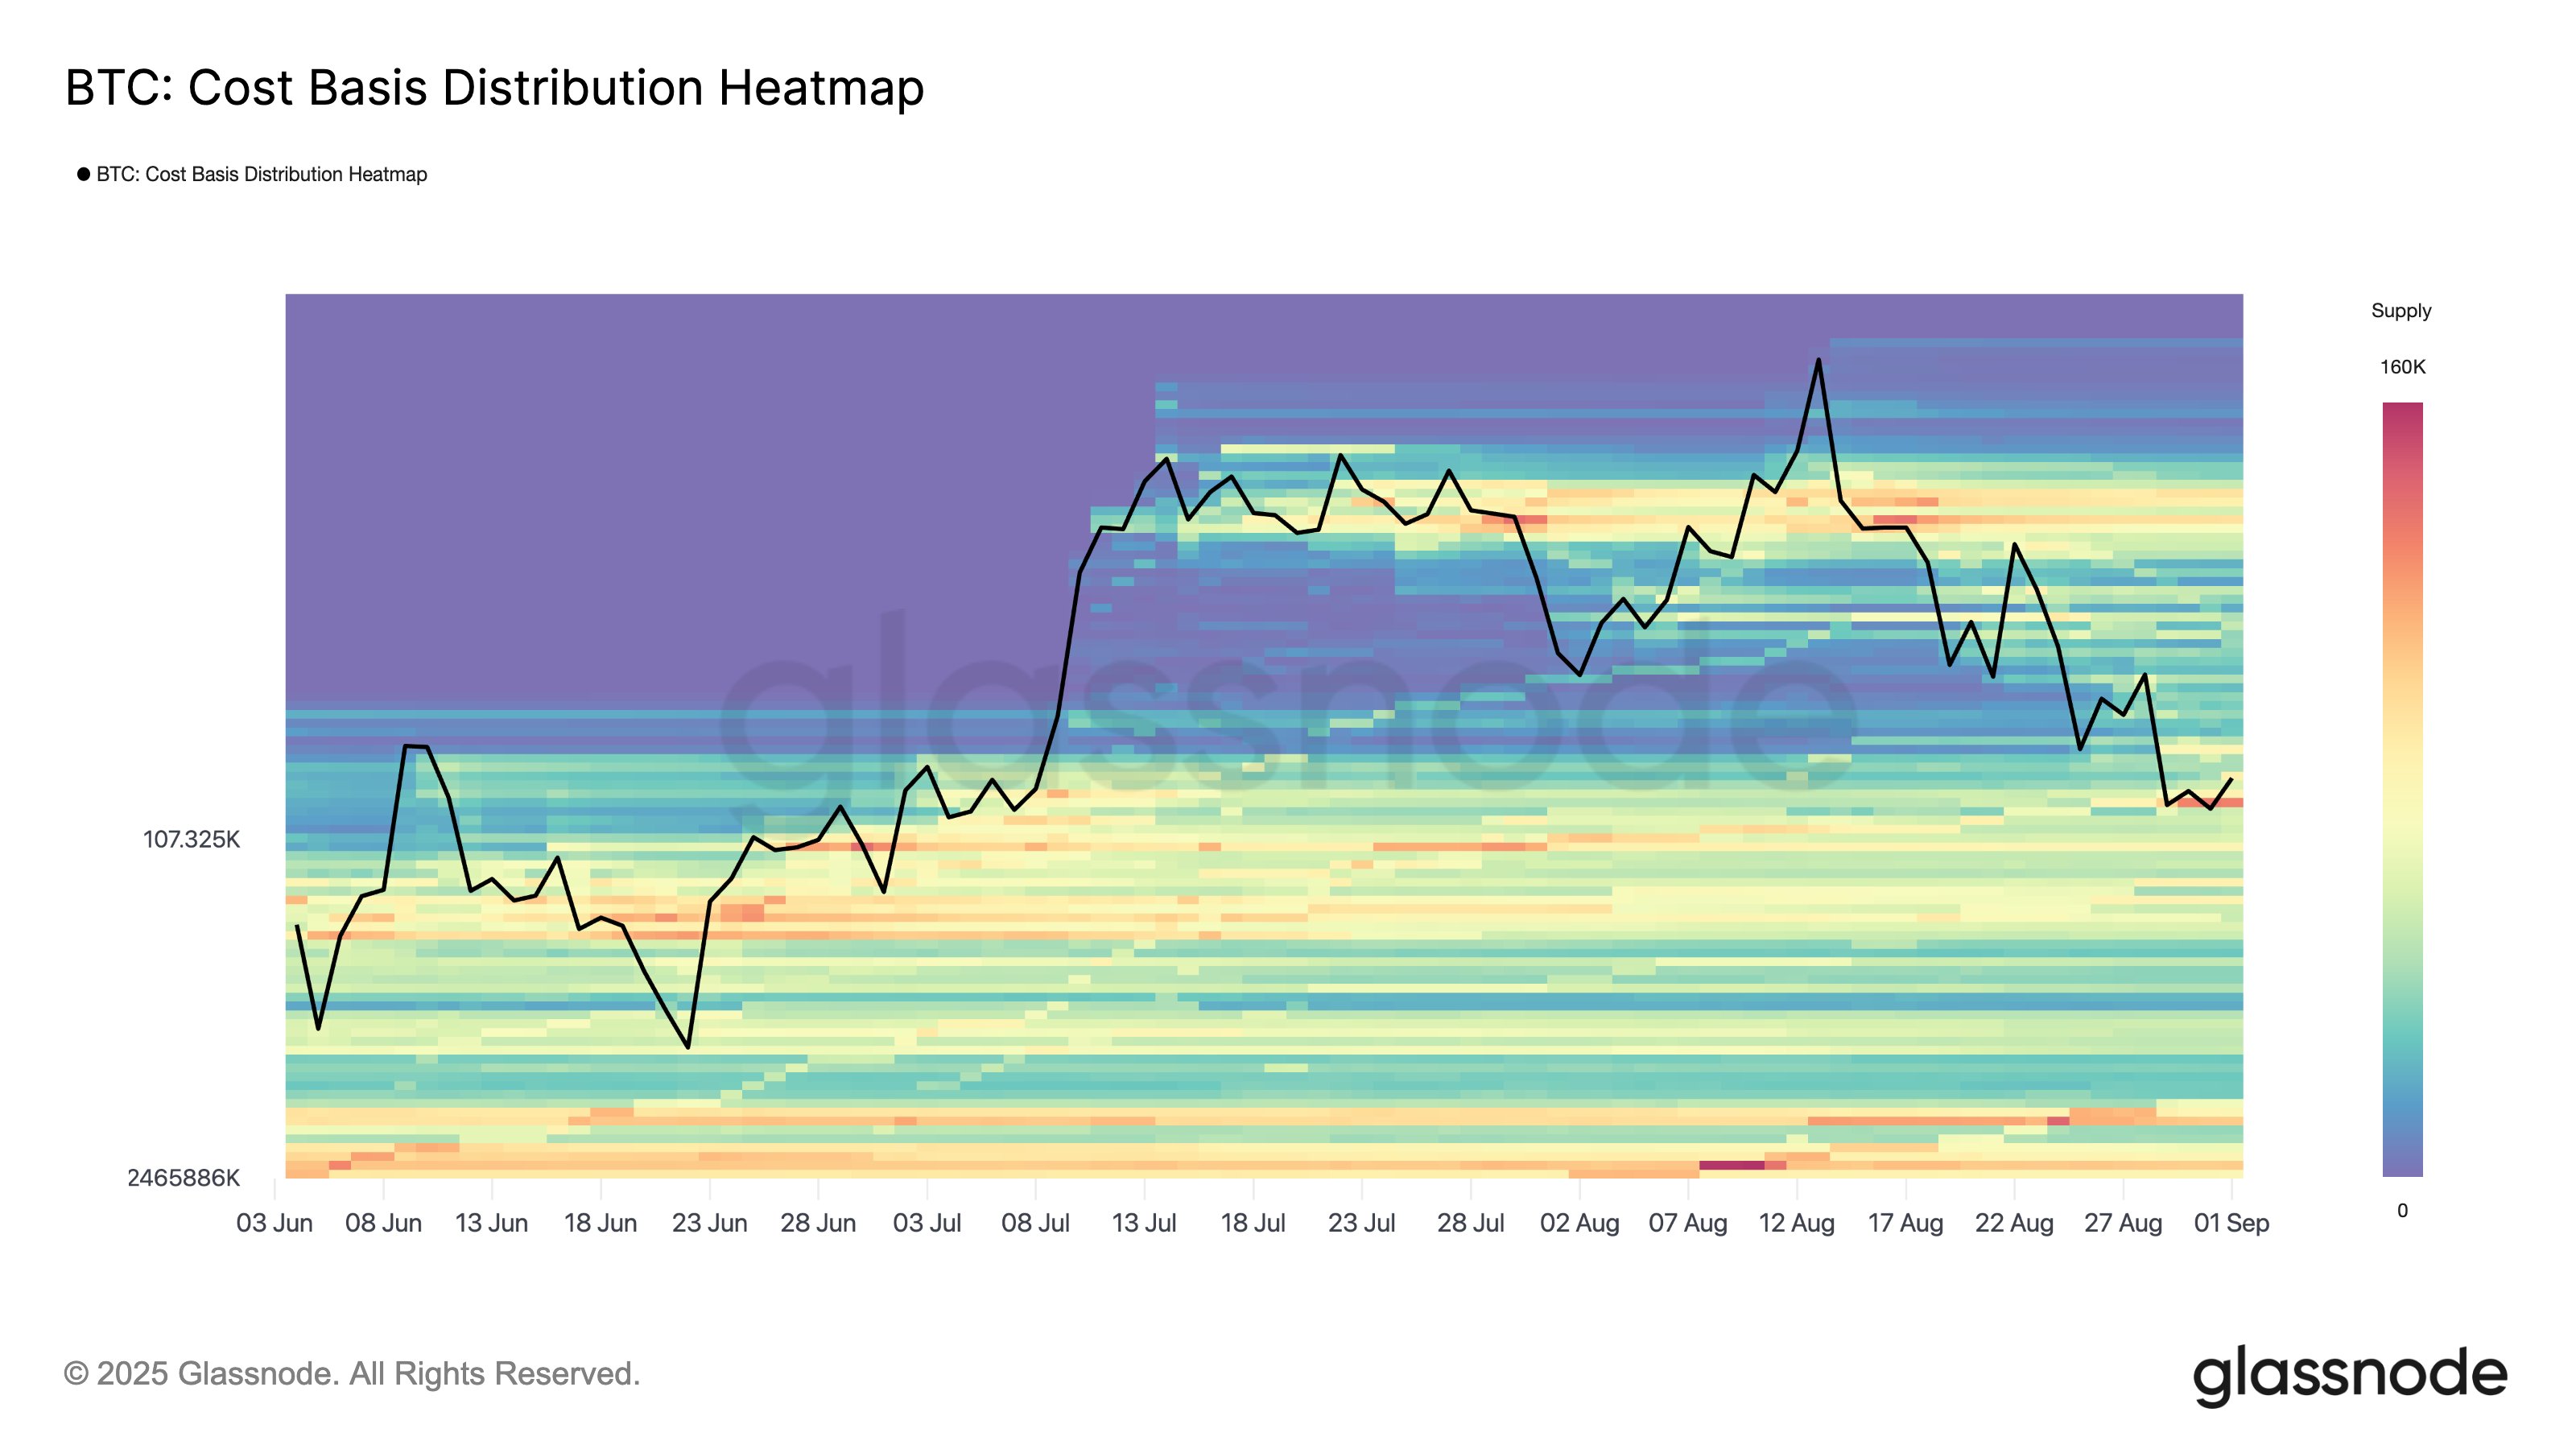
Looks like BTC is currently retesting a major demand zone | Source: Glassnode on X
As displayed in the above graph, the Bitcoin CBD acquired a large “air gap” when Bitcoin saw its explosive rally back in July. This happened because BTC moved through price levels too fast for buying and selling to occur at them, so very few coins were able to receive a cost basis at them.
As BTC consolidated after the rally cooling off, levels started being filled up with supply. The same has followed during the latest phase of decline and now, the previous air gap has disappeared. This shows that demand for spot trading has maintained for the cryptocurrency.
While Bitcoin has seen this trend, the CBD has behaved differently for the second largest asset in the sector, Ethereum.

How the CBD has changed for ETH over the past few months | Source: Glassnode on X
From the chart, it’s apparent that Ethereum’s rallies have also created air gaps, but unlike Bitcoin, its phases of slowdown haven’t resulted in any levels filling up to a notable degree. “This suggests ETH price dynamics may be more influenced by off-chain markets such as derivatives,” notes Glassnode.
Historically, price action built on products like derivatives has often proven to be more volatile. Given that Ethereum is currently not observing any high levels of spot buying, it only remains to be seen what the fate of its bull run would be.
In some other news, Bitcoin has been trading near an important on-chain cost basis level after the recent price decline, as CryptoQuant author Maartunn has pointed out in an X post.
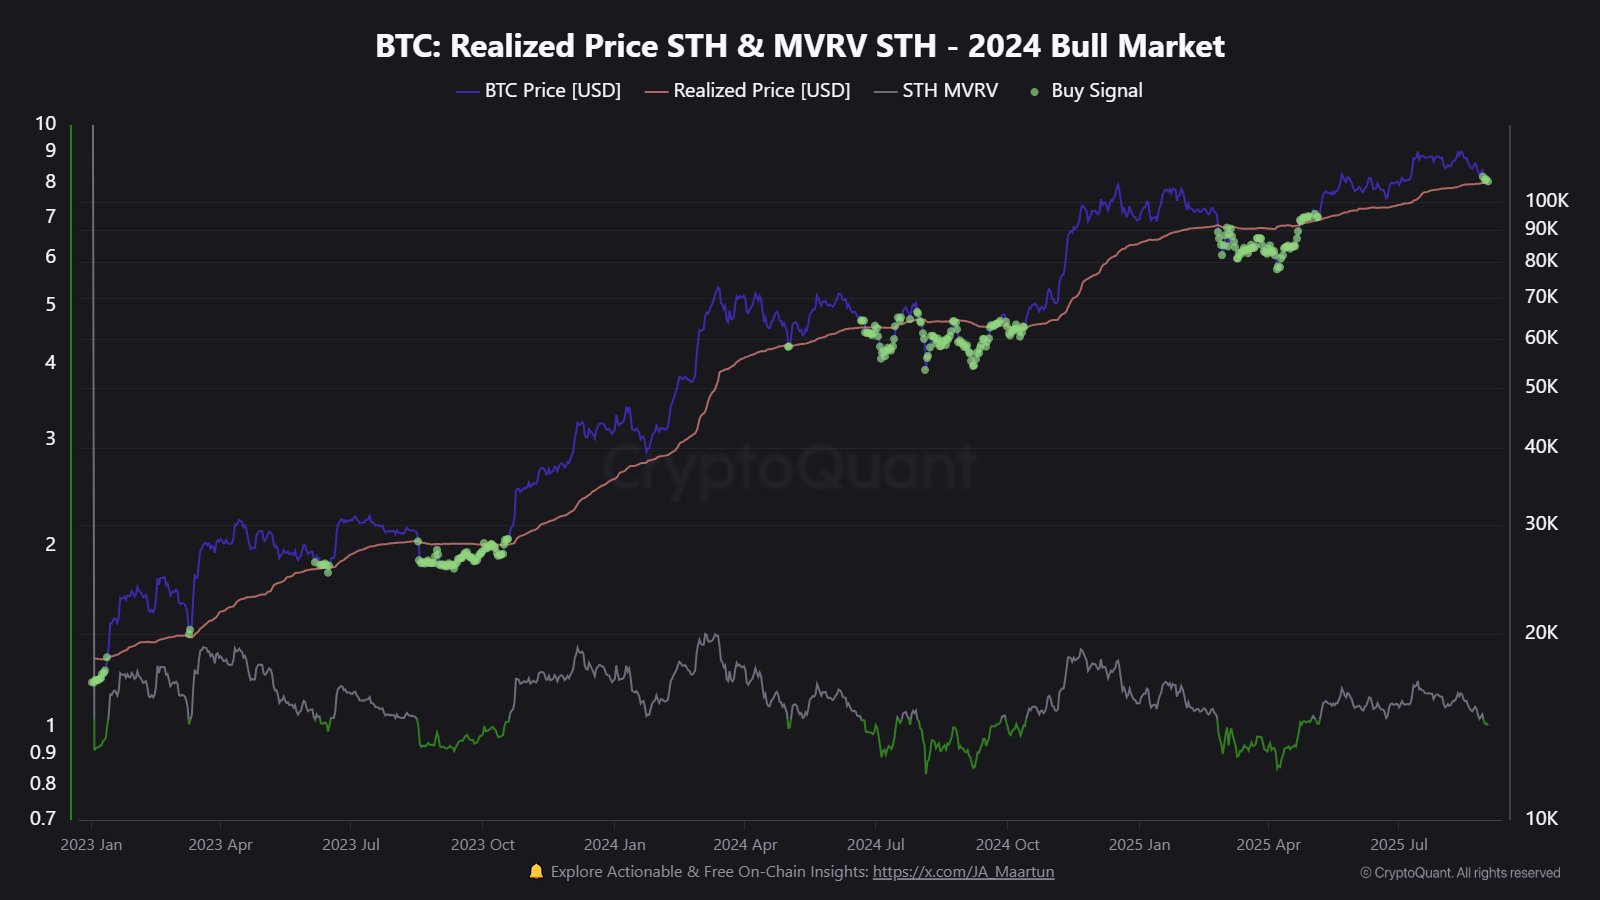
The trend in the Realized Price of the BTC short-term holders | Source: @JA_Maartun on X
The level in question is the average cost basis of the short-term holders, investors who purchased their Bitcoin within the past 155 days. In the past, losing the level often resulted in short-term shifts to bearish phases.
ETH Price
Ethereum has been on the way down recently with its price falling to $4,270 after a 6% weekly pullback.
The price of the coin appears to have gone down recently | Source: ETHUSDT on TradingView
Featured image from Dall-E, CryptoQuant.com, Glassnode.com, chart from TradingView.com

Editorial Process for bitcoinist is centered on delivering thoroughly researched, accurate, and unbiased content. We uphold strict sourcing standards, and each page undergoes diligent review by our team of top technology experts and seasoned editors. This process ensures the integrity, relevance, and value of our content for our readers.