

TLDR
- ETH is holding near the $2,000 support level after being rejected at $2,372 earlier this month.
- The long/short ratio has climbed to 2.4, but the price isn’t moving up to match, which raises squeeze risk.
- U.S.-listed Ethereum ETFs saw $92.5 million in outflows on March 26.
- A record $14.16 billion Bitcoin options expiry and geopolitical tensions added selling pressure.
- Key resistance sits at $2,138–$2,151, and a drop below $1,980 could push ETH toward deeper lows.
Ethereum is trading around $2,048 as bulls try to hold the $2,000 support level. The price rallied earlier in the month but ran into a wall near $2,372. Since then, ETH has been stuck in a tight range between $1,900 and $2,200.
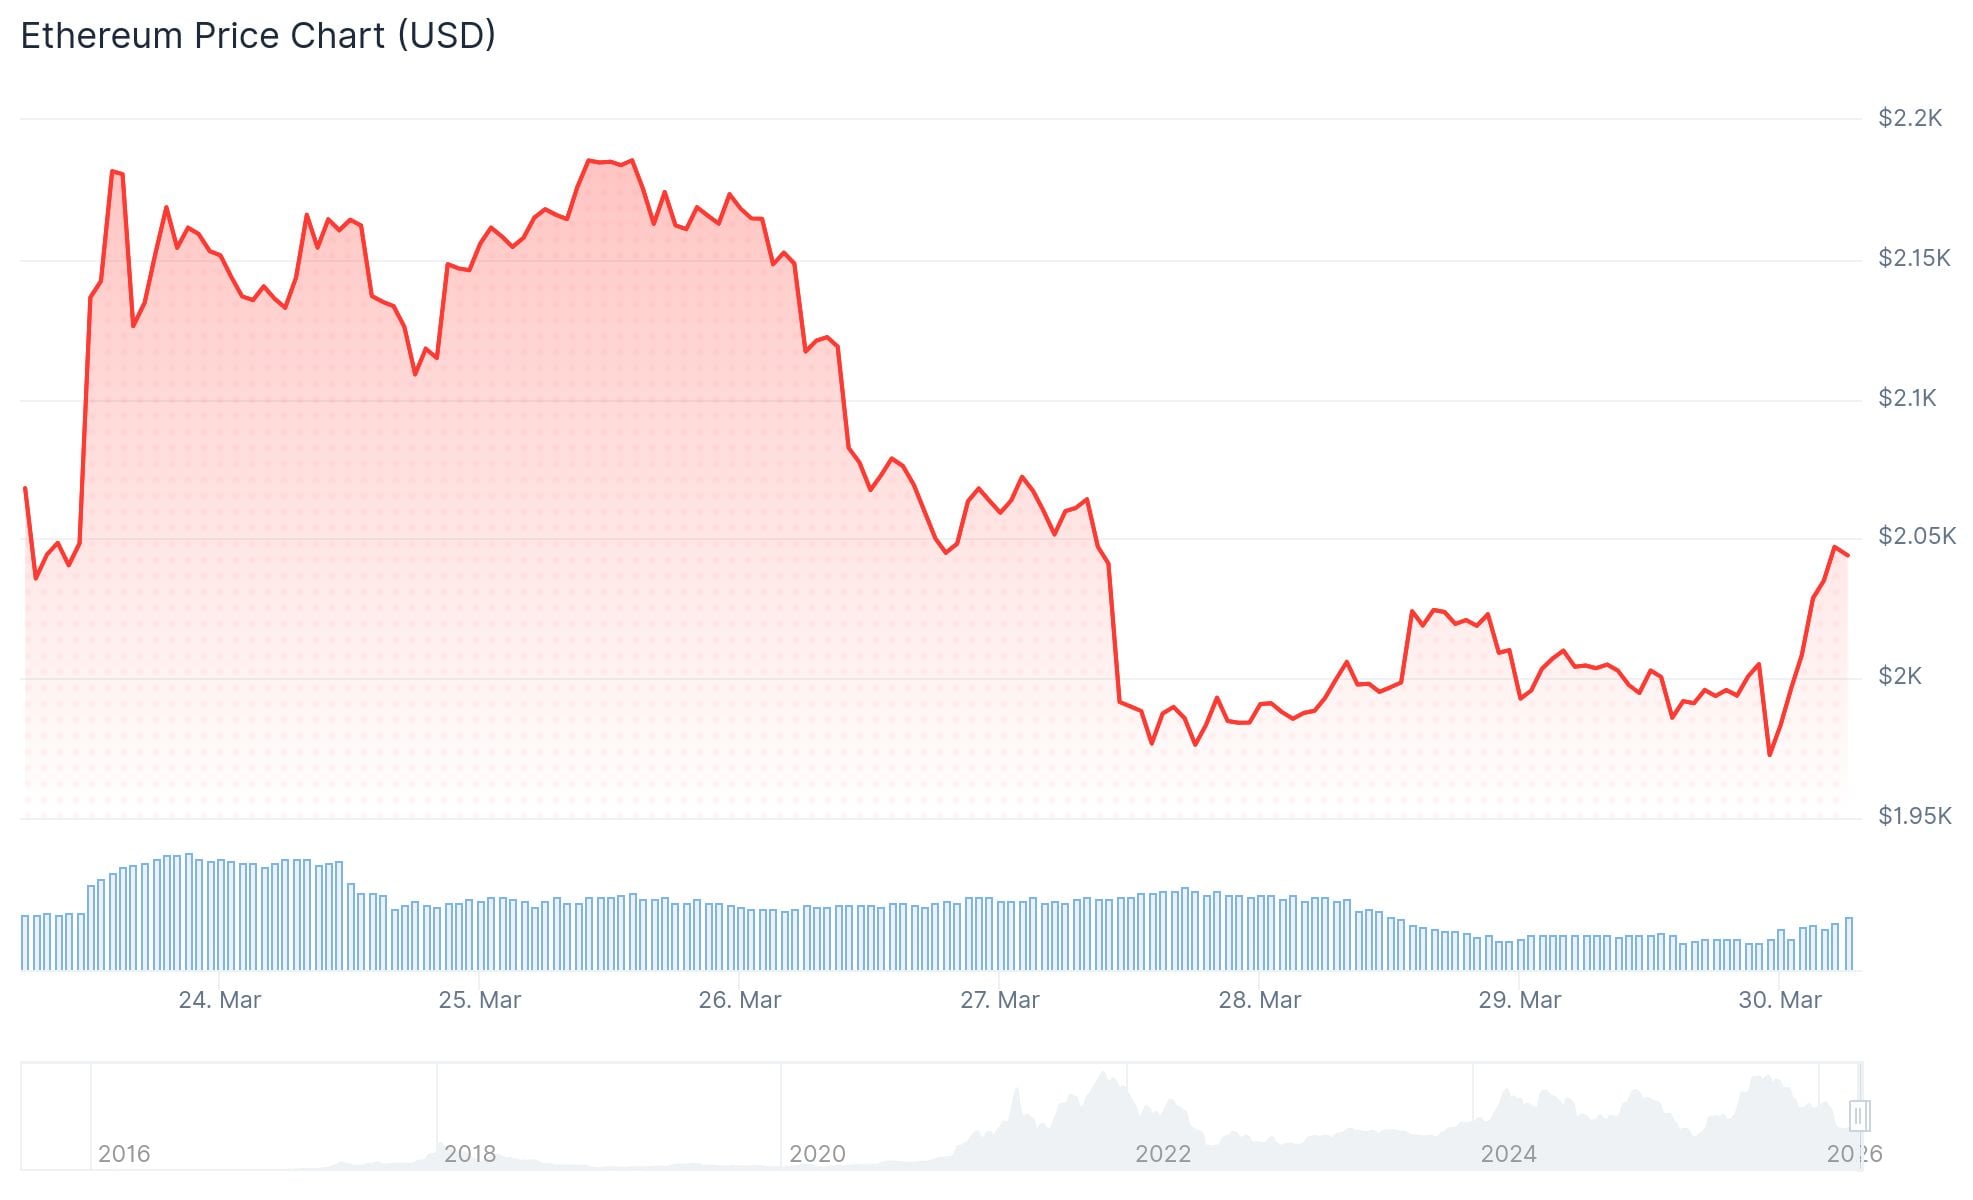
The price currently sits below the 50-day exponential moving average of roughly $2,160 and well below the 100-day EMA near $2,420. That keeps the broader trend tilted downward.
The RSI on the daily chart is at around 44, which is below the neutral 50 level. The MACD is also trading below its signal line and drifting toward zero. Both indicators point to fading buying momentum.
One thing traders are watching closely is the long/short ratio. It has risen to about 2.4, meaning more traders are betting on a price increase. But the price hasn’t followed.
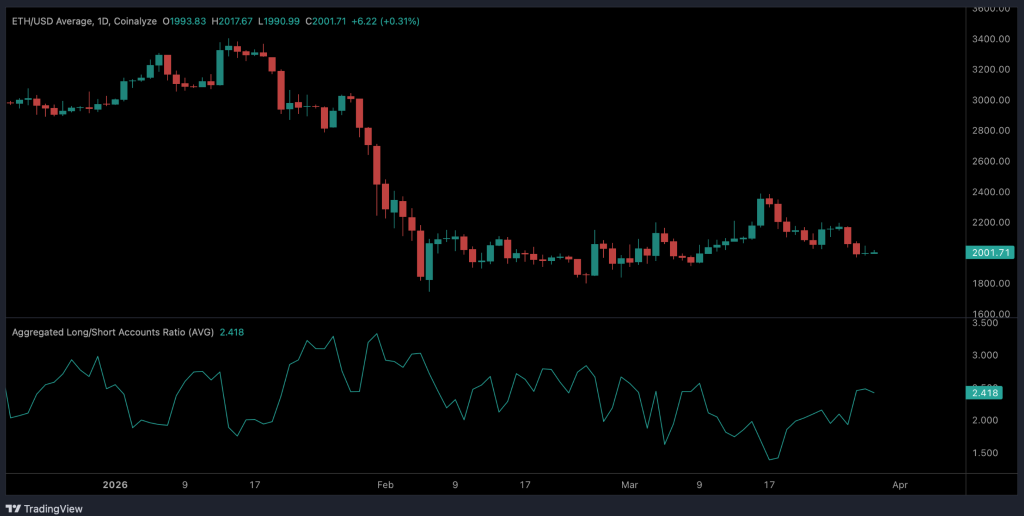
When long positions pile up but the price stays flat, it can create what traders call a “crowded trade.” That kind of setup can lead to a long squeeze, where a sudden drop forces leveraged buyers to sell, pushing the price down further.
ETF Outflows and Market Pressure
On March 26, U.S.-listed Ethereum ETFs recorded $92.5 million in outflows. This was part of a broader wave of redemptions across crypto ETFs.
According to SoSoValue data, on March 27 (ET), U.S. Bitcoin spot ETFs recorded a total net outflow of $225 million. Meanwhile, Ethereum spot ETFs saw a total net outflow of $48.54 million, marking an eight-day streak of net outflows. pic.twitter.com/ell1RDmAqI
— Wu Blockchain (@WuBlockchain) March 28, 2026

The day before, on March 27, a record $14.16 billion in Bitcoin options expired. Large options expiries often bring volatility, and this one added to selling pressure across the crypto market.
Geopolitical factors also played a role. Rising oil prices, linked to Iran’s threat to block a major shipping route, stoked inflation concerns. That kind of environment tends to weigh on risk assets like Ethereum.
Key Levels to Watch
On the upside, $2,138 is the 23.6% Fibonacci retracement level from the high of $3,402 down to the low of $1,747. The Ichimoku Kijun level sits at $2,151, and traders are watching a close above this zone as a possible trigger for a move toward $2,380.
On the downside, $1,990 is the first support to watch. Below that, the channel floor sits near $1,748. A clean break below that zone could extend the bearish trend.
The next five trading days are expected to see ETH consolidate between $1,980 and $2,170, with the probability of a price increase below 20%, according to technical analysis.
Ethereum $ETH faces a major test at $1,800! pic.twitter.com/7Jv5c8gTI3
— Ali Charts (@alicharts) March 30, 2026
Analyst Ali Charts posted on X that Ethereum faces a “major test at $1,800,” suggesting some market watchers see even lower levels as a possibility if current support breaks.
Analyst Tom Lee has said he believes Ethereum could reach $62,000 over the long term, though no timeline was given for that target.
Ethereum ETF outflows totaled $92.5 million on March 26 as ETH held near $2,000 with technical indicators pointing to continued short-term weakness.
