

Cardano price is showing renewed strength, reclaiming a top 10 spot as key technicals and risk metrics hint at a potential breakout toward $1.00 and beyond.
Cardano price is starting to flash real signs of strength after months of flying under the radar. With a 16% weekly gain and a return to the top 9 by market cap, market watchers are beginning to pay attention again.
Cardano Price Climbs Back into the Top 9
Cardano price is quietly starting to reassert itself in the large-cap ranks, as shown by new data from Coin Bureau. With a 16.29% gain over the past seven days, ADA has overtaken TRON on CoinMarketCap, pushing its market cap to $30.4 billion, just enough to reclaim the 9th spot. This move isn’t just about price; it reflects a broader return in interest and inflows into the Cardano ecosystem, particularly as risk conditions return.
Cardano reclaims the 9th spot on CoinMarketCap with a 16.29% weekly surge, signaling renewed strength in large-cap rankings. Source: Coin Bureau via X
TRON, in comparison, managed only a 4.69% weekly gain, suggesting that capital rotation is beginning to favor projects with stronger recovery structures. Cardano’s climb up the leaderboard might seem small, but for long-time ADA watchers, it signals a shift. The charts are starting to align with fundamentals, and this quiet reappearance in the top 10 could be the first sign of a more sustained revaluation ahead.
Cardano’s Risk Score Echoes Historical Accumulation Zones
Cardano’s current positioning on the Crypto Capital Venture risk chart is quietly catching attention. With a long-term risk score of 43, ADA sits at a level historically associated with early-stage accumulation phases. The last time risk was this low under similar macro and cycle conditions, ADA was priced around $0.10, now it’s hovering near $0.80. That delta alone gives context to what a risk-adjusted opportunity might look like in the current phase.
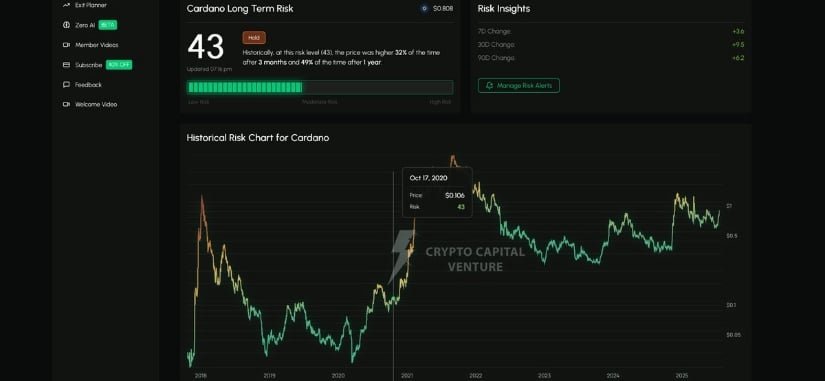
Cardano’s risk score sits at 43, matching levels seen during past accumulation phases that preceded major rallies. Source: Dan Gambardello via X
What stands out here is the confluence between cycle timing and sentiment reset. While price is up significantly from prior lows, this mid-range risk zone suggests the market hasn’t overheated yet. It supports the idea that ADA could still have room to run, especially if it replays its prior cycle pattern, where similar risk levels preceded a major leg up.
Cardano Price Eyes Breakout Towards $1.00
Following its reclaim of the top 9 spot and a historically low risk score, Cardano’s short-term technical setup is now starting to align with those broader signals. As shown in the latest 4-hour chart shared by Sssebi, ADA is consolidating just beneath a key resistance band between $0.85 and $0.87. The structure shows a textbook ascending triangle, with higher lows pressing against a flat resistance.
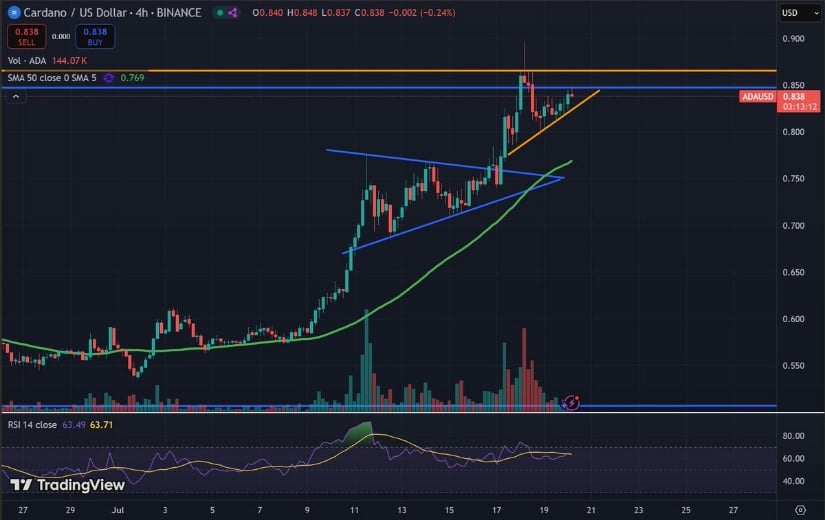
Cardano price forms an ascending triangle just below $0.87, with momentum and structure pointing toward a potential breakout to $1.00. Source: Sssebi via X
Momentum remains intact as Cardano price holds above both the 50SMA, while volume has contracted during this consolidation, a sign that the market may be coiling for expansion. A clean breakout above $0.87 would put $1.00 firmly in play as the next target, with minor resistance around $0.93 along the way.
Medium Term Cardano Price Prediction Points Toward $1.80
While short-term charts show ADA tightening under $0.87, the bigger picture may be signaling something far more substantial. The weekly structure posted by FLASH highlights a breakout from a multi-month falling wedge.
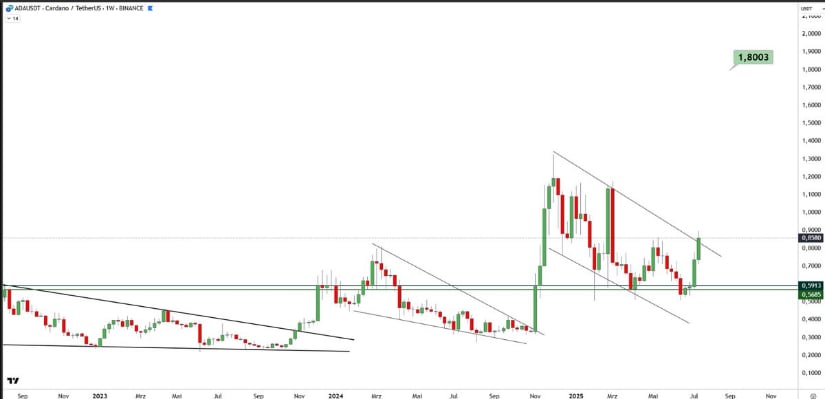
Cardano breaks out of a multi-month falling wedge, with weekly structure hinting at a potential move towards the $1.80 zone. Source: FLASH via X
The resistance trendline that previously capped price since the 2024 highs has now been breached, with ADA reclaiming both the wedge and horizontal support near $0.80. The reaction looks technically clean and measured, not parabolic.
What makes this setup compelling is the breakout’s alignment with both macro structure and prior cycle behavior. If the momentum for Cardano continues to hold, the $1.80 region, marked in the chart as a major horizontal level and psychological round number, stands out as a reasonable medium-term target.
Cardano’s Weekly MACD Turns Positive
Cardano’s momentum shift is starting to show up in the weekly indicators as well. This latest MACD chart from Nobuya reveals a potential bullish crossover just as the histogram flips green for the first time in days. After a prolonged stretch of fading red bars, the signal line is curling up through the MACD line, often a reliable trend reversal sign when it happens on the higher timeframes. This kind of shift doesn’t confirm immediate price action, but it does suggest that ADA is stepping out of the exhaustion phase and may be entering a trend-building zone, especially if confirmed by weekly closes above $0.87.
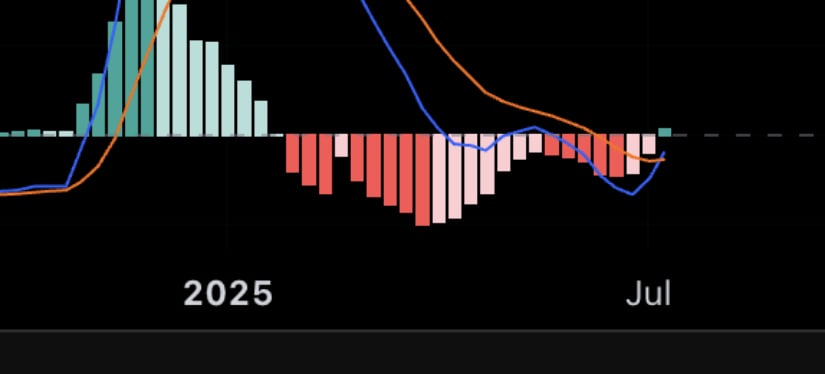
Cardano’s weekly MACD flips green with a bullish crossover, hinting at a potential trend reversal on higher timeframes. Source: Nobuya via X
Final Thoughts
Cardano is slowly but surely starting to look like it’s back in the game. The combination of a low-risk score, fresh momentum signals like the weekly MACD flip, and clear technical formations all paint a picture of a project quietly positioning itself for a bigger move.