

Shiba Inu (SHIB): Trading around $0.00000506 inside a dense moving-average cluster. Resistance sits at $0.00000510-$0.00000520, while losing $0.00000490 could expose $0.00000460-$0.00000470.
Zcash (ZEC): Strong momentum continues near $1,376 after breaking above $1,250-$1,300. $1,400 is the immediate resistance, while $1,300 and $1,200-$1,250 are key supports.
Ethereum (ETH): Consolidating near $2,455 after August’s breakout. $2,400 remains the main short-term support, with $2,500-$2,560 acting as resistance. The broader structure stays constructive while ETH holds above its major moving averages.
Dogecoin (DOGE): Trading near $0.0813 after another rejection from $0.090-$0.092. Support sits around $0.079-$0.080, while bulls need to reclaim $0.084-$0.085 before challenging $0.090-$0.094. Lower highs keep the broader structure under pressure.
Shiba Inu continues to trade in an uncomfortable technical position, with the price trapped directly inside a dense cluster of moving averages.
One Shiba Inu fail after another
Resistance in the $0.00000510–$0.00000520 range is the most pressing issue. Since late August, SHIB has made several trips through this region, but it has not been able to establish itself as a trustworthy support level.
After the September rally toward roughly $0.00000555 was rejected, the price action that followed resulted in weaker highs. Around $0.00000495-$0.00000510, a number of moving averages have now converged. Although SHIB currently lacks convincing momentum, such compression can precede a larger move. Compared to the August breakout, trading volume has significantly decreased, and the RSI is currently at the neutral 50 level.
You Might Also Like

The larger framework is still inadequate. The long-term moving average is still falling near $0.00000565, which keeps SHIB well below a significant trend barrier. Maintaining $0.00000490-$0.00000500 preserves the current consolidation.
If that level were lost, $0.00000470-$0.00000460 and $0.00000440 would be exposed. Bulls must instead move steadily above $0.00000520, with the next significant barrier being $0.00000550. For the time being, SHIB remains weak on the larger daily structure and technically uncertain in the short term.
Zcash hits the ceiling
ZEC reached about $1,376 following another near-vertical breakout, demonstrating Zcash’s remarkable momentum. ZEC has surged straight into new highs, in contrast to many large-cap cryptocurrencies that are currently experiencing corrections. A consolidation between roughly $1,080 and $1,240 preceded the most recent expansion.
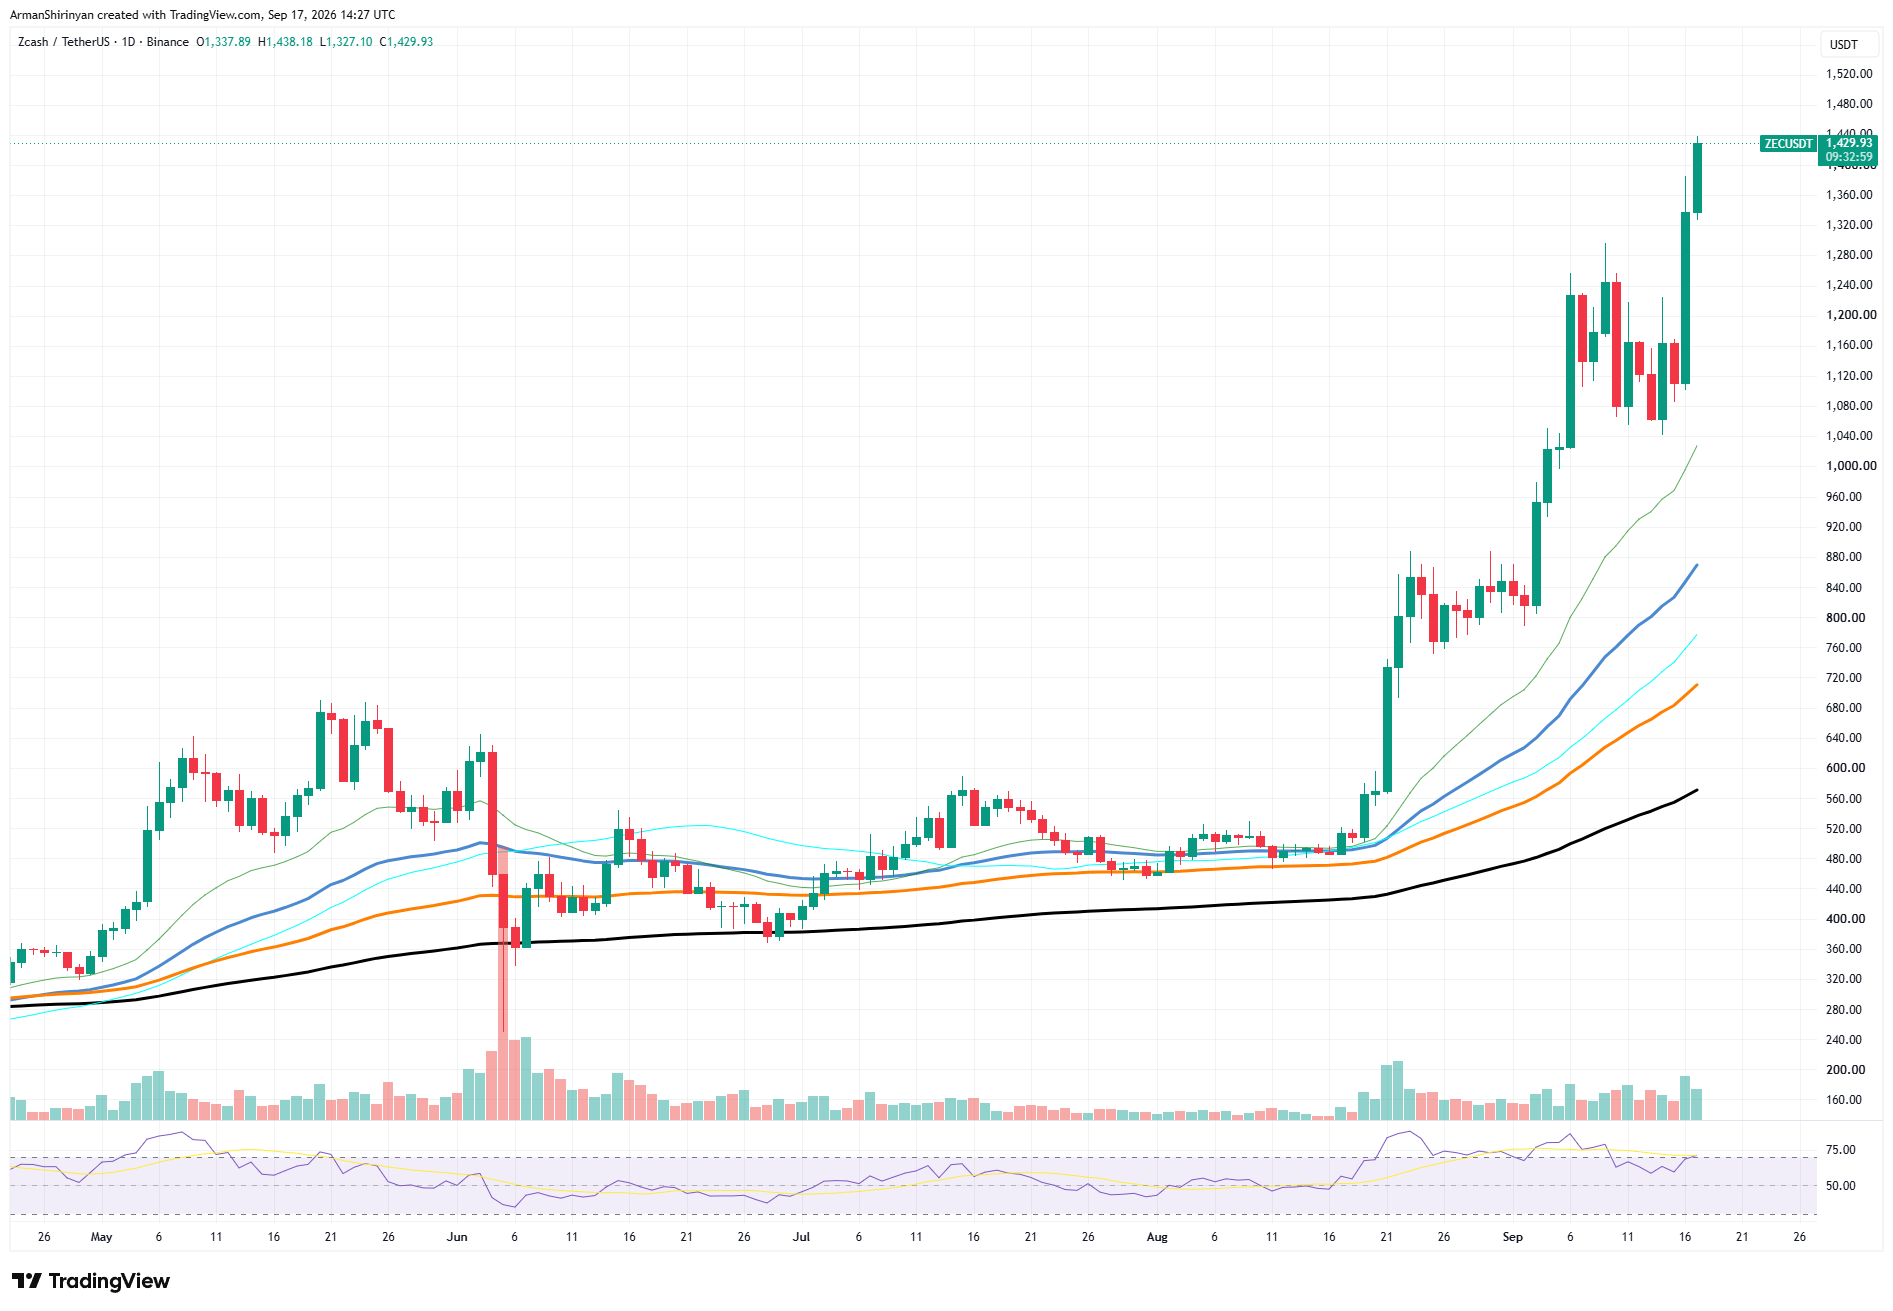
After its massive prior advance, ZEC found buyers around the lower boundary and then soared through $1,250–$1,300 instead of breaking down. Strong separation of the moving-average structure is still present. While the medium-term averages are still much lower at $850, $780, and $700, the fastest average has already surpassed $1,000.
This not only demonstrates how extended ZEC has become relative to its underlying averages, but it also validates the strength of the trend. Although it has not yet reached some of the extreme readings produced during earlier breakout phases, the RSI has moved back toward the 70 region and is approaching overbought territory.
You Might Also Like

There is $1,400 in psychological resistance right now. If it were cleared, this chart would have comparatively little visible historical resistance, which could encourage further price discovery. However, the risk of volatility remains very high.
The former breakout region, located between $1,200 and $1,250, follows the first significant support, which is located around $1,300. A more significant correction might return to $1,100. As a result, ZEC continues to exhibit an exceptionally strong trend; however, following such a significant vertical expansion, even a standard technical correction may result in substantial absolute price movement.
Ethereum’s consolidation is ending
Following its strong August breakout, Ethereum is consolidating, but the daily structure is still much stronger than it was prior to the move. After recovering from another test of the $2,400 area, ETH is currently trading at about $2,455. The range created after ETH shot up from about $1,900 to over $2,500 is the chart’s primary feature.
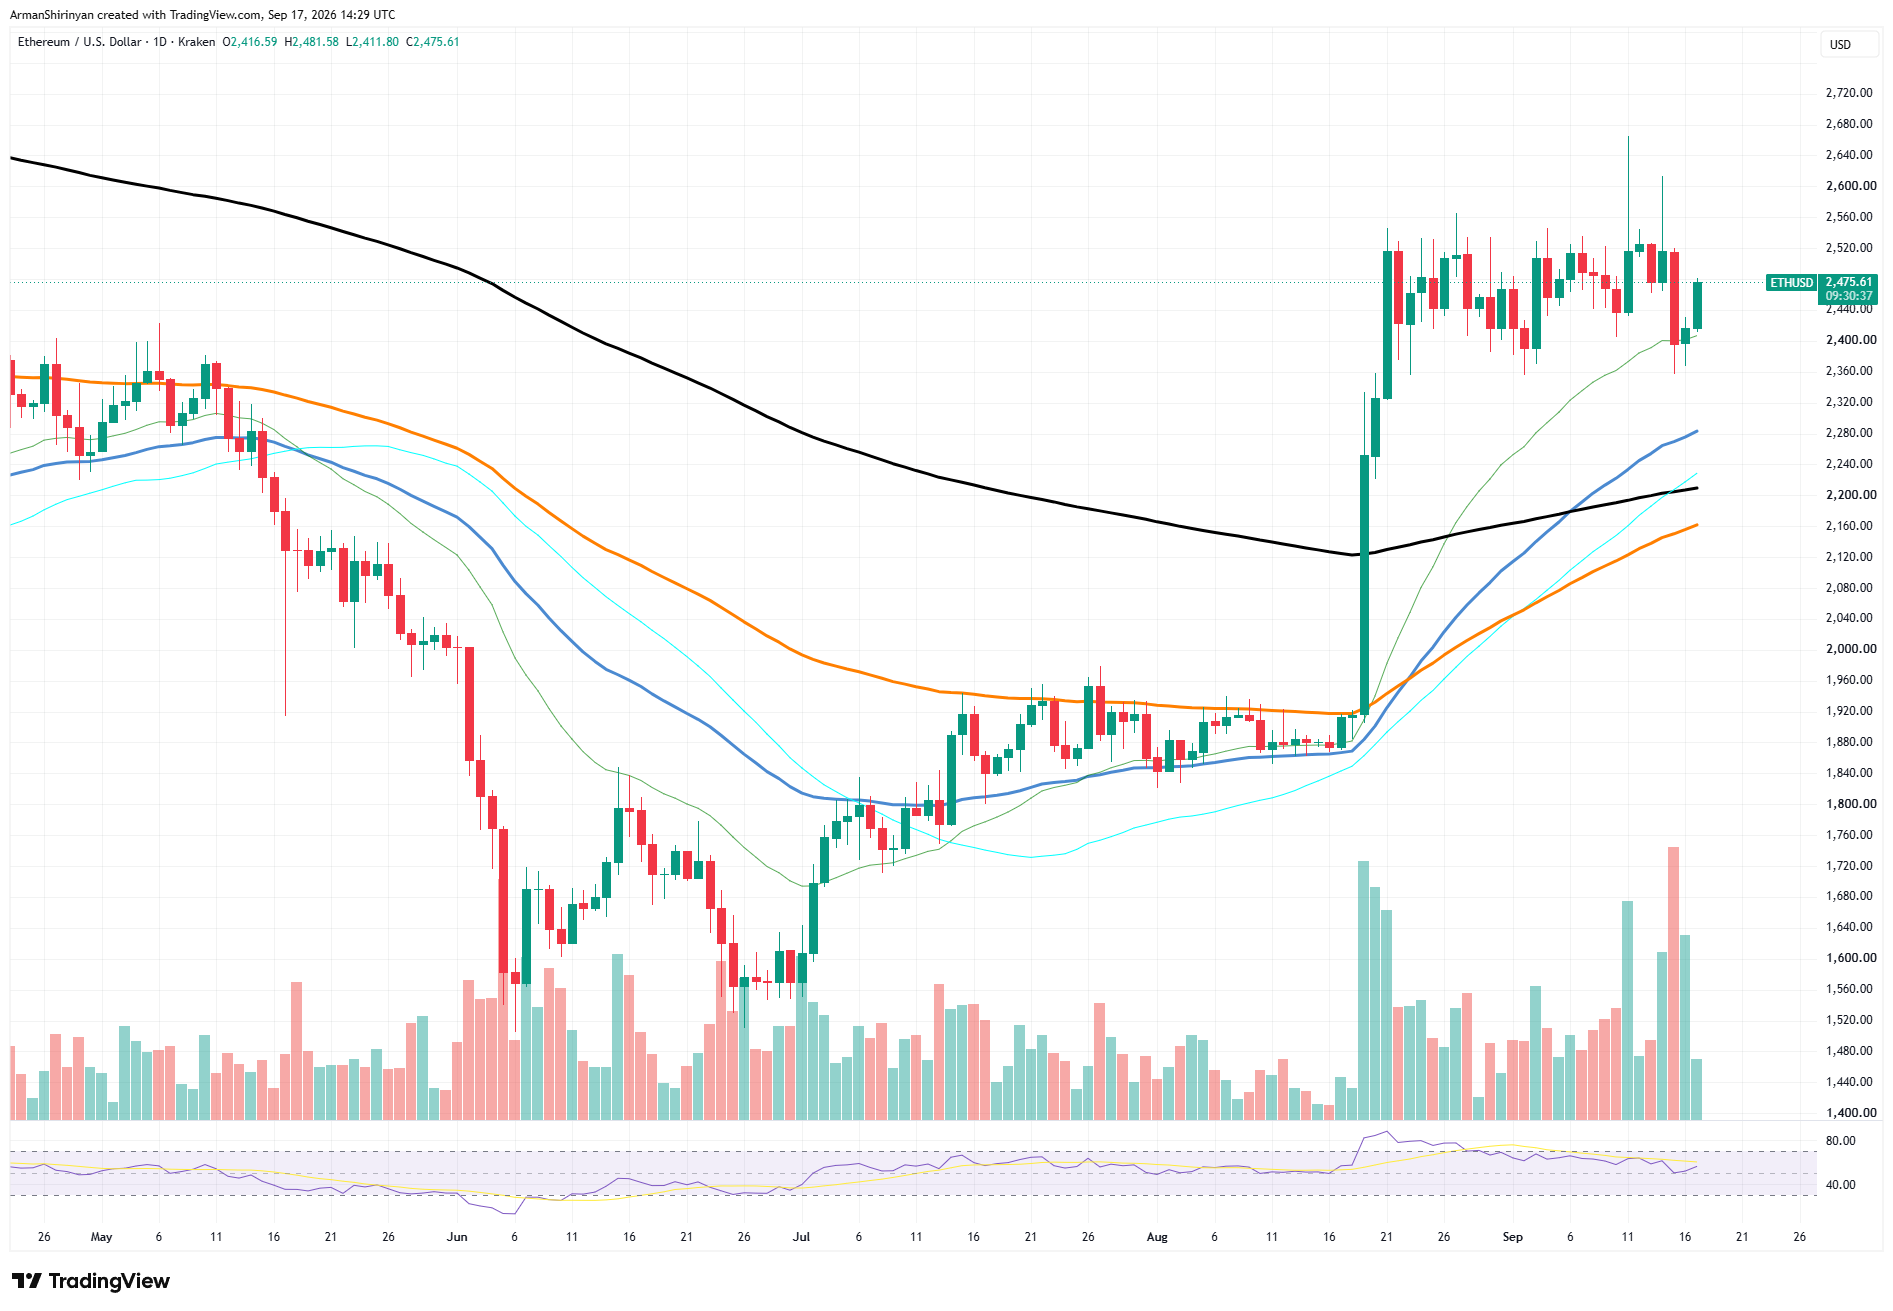
Sellers have also had difficulty forcing a sustained breakdown below $2,400 since late August, despite repeated attempts to extend beyond $2,520–$2,560 failing. ETH is now in a comparatively clear consolidation as a result. Short-term momentum has diminished.
After reaching overbought territory during the breakout, the RSI has declined toward the neutral 50 region. Recent volume spikes have also coincided with downward volatility, making it clear that $2,400 cannot be regarded as a wholly reliable support level. Nevertheless, the broader moving-average structure continues to be constructive.
You Might Also Like
With a dense cluster between $2,160 and $2,220 and the nearest stronger support at $2,280, ETH is trading comfortably above its major averages. The immediate levels are straightforward.
A correction toward $2,280 could be accelerated by a break below $2,360. Conversely, ETH must recover $2,500 and ultimately break $2,560 in order to resume the August advance. Consolidation remains the predominant structure until either boundary breaks.
Dogecoin’s uncomfortable position
Dogecoin is in a much less comfortable position. After another rejection from the $0.090-$0.092 region and a decline straight into its moving-average cluster, DOGE is currently trading near $0.0813. The August breakout seemed promising at first. DOGE spiked from roughly $0.070 to $0.094 and momentarily wicked above $0.10.
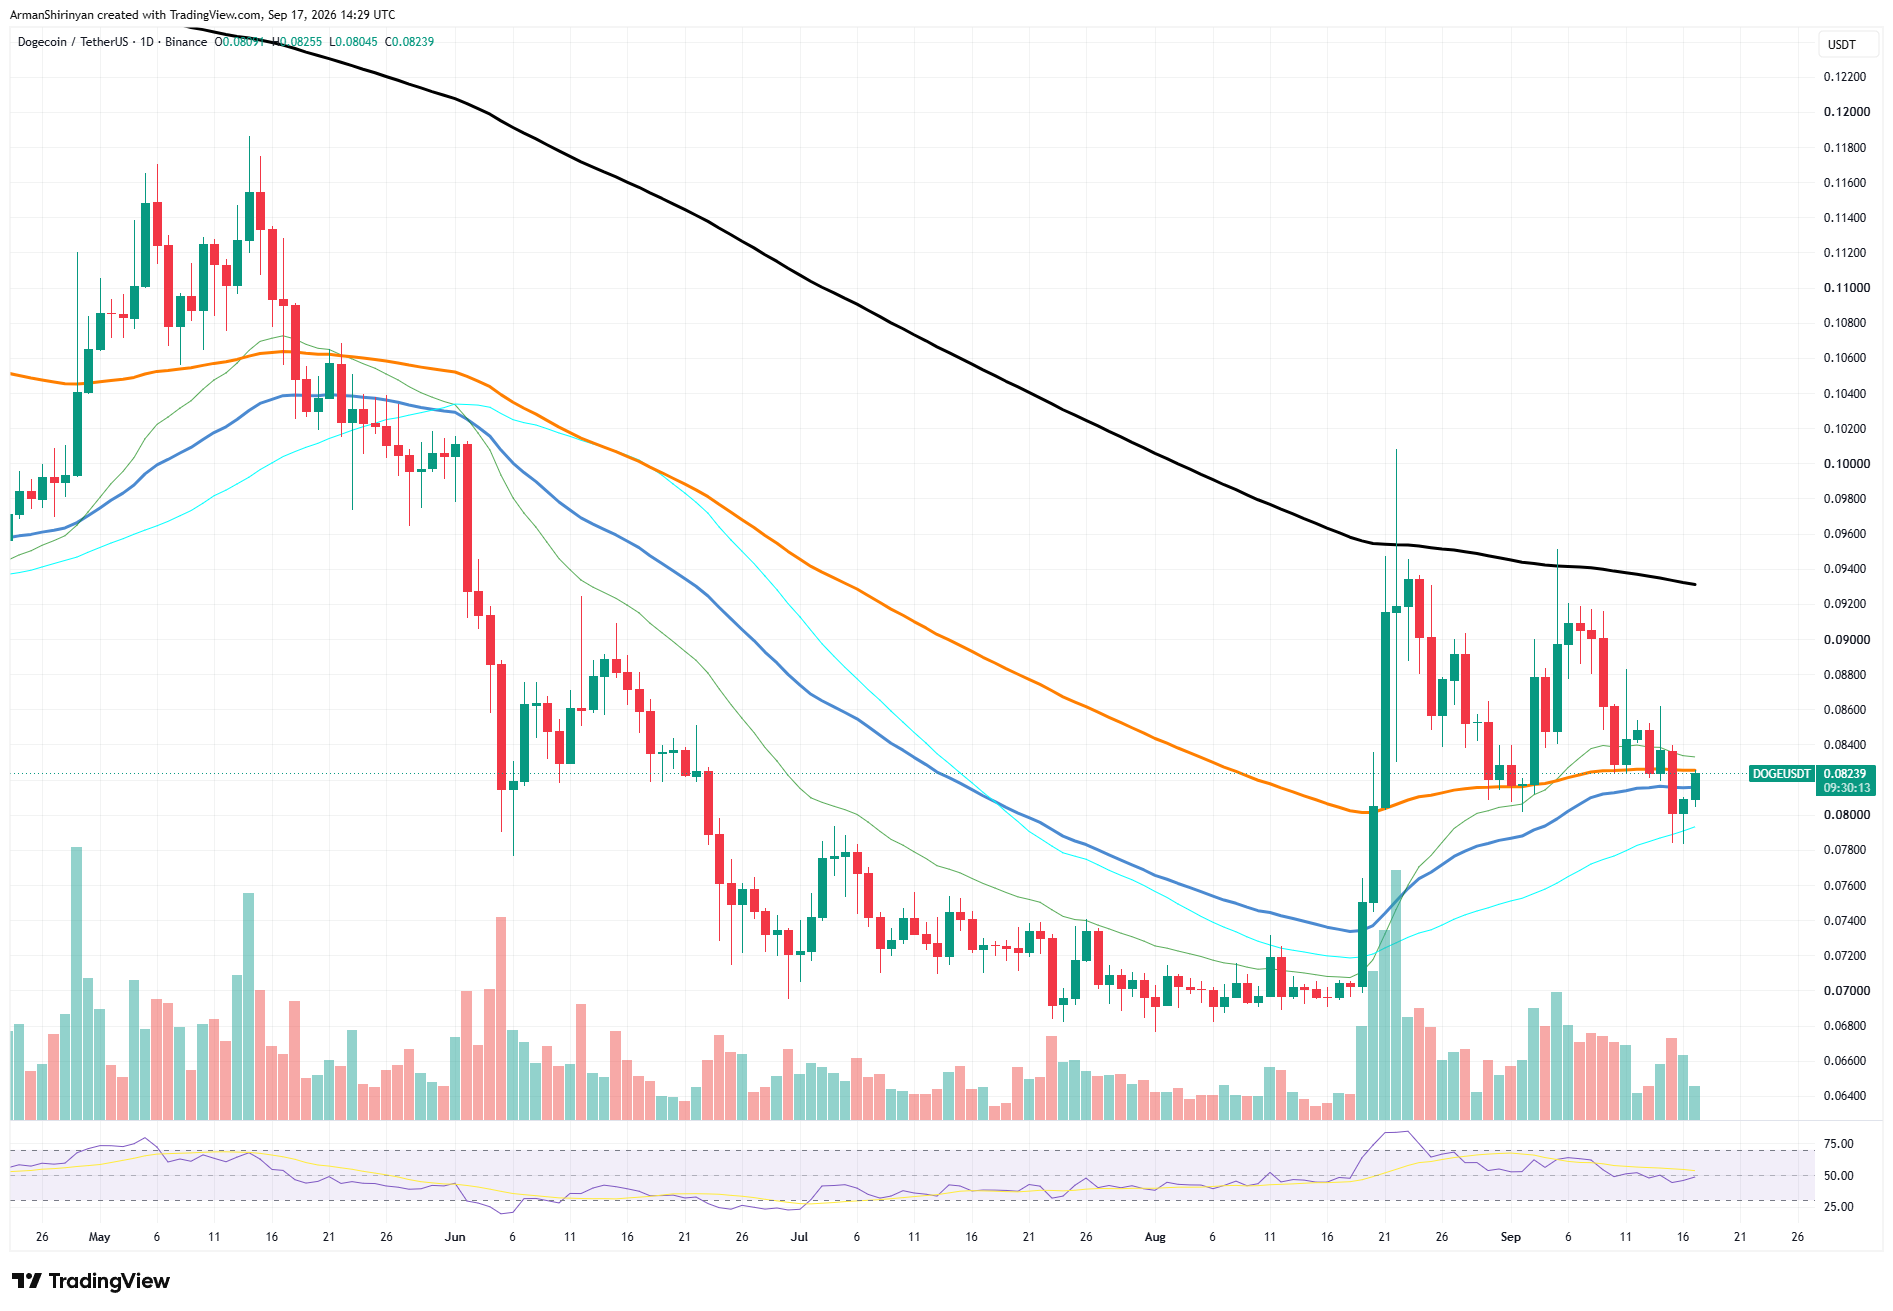
Nevertheless, buyers were unable to sustainably move above the long-term moving average, which is currently near $0.093. The second attempt at that level in September was also unsuccessful. After that, DOGE formed lower highs and fell back below the short-term averages, which were between $0.082 and $0.084.
You Might Also Like

There is little indication that buyers have picked up steam, as the RSI has been falling and is currently in the neutral range. $0.079-$0.080 is the immediate support area. DOGE recently produced a long lower wick from this area, indicating that there may still be some demand there.
$0.076 and the previous accumulation area between $0.070 and $0.072 could be exposed in a daily breakdown. DOGE must first recover $0.084–$0.085. The much more significant resistance zone above that remains $0.090-$0.094. Until then, it appears increasingly likely that the August breakout was an unsuccessful attempt to buck the broader downward trend.
