


Although Bitcoin is still consolidating around $64,200, the daily chart still indicates that the market is torn between a much weaker long-term structure and short-term stabilization. After rising from its late-June low of about $58,000, Bitcoin has been moving sideways for the majority of July and August.
Looking into short-term direction
The immediate technical structure has made a minor improvement. The short-term moving averages, which are centered around $63,750 and $63,900, are exceeded by Bitcoin. Additionally, the RSI has moved to about 52, giving buyers a slight momentum advantage without indicating an overbought situation. BTC hasn’t been able to convert this stabilization into a bigger breakout, though.
The $66,000–$67,000 area is the most significant near-term resistance because the next major moving average is located close to $66,300 and has a downward slope. The first significant sign that the current range is becoming a recovery structure would be a daily breakout above this region.
You Might Also Like

The long-term moving average stays at roughly $71,500 beyond that. Regaining it would necessitate a much more forceful move and would signify a more significant shift in Bitcoin’s overall trend. The immediate support on the downside is still $63,000. Losing it would expose $60,000–$61,000, with the June–July lows at about $58,000 coming next.
As a result, Bitcoin is still in compression. Although buyers have halted the decline, they still don’t have enough power to turn it around. The next significant directional signal should come from a break outside of the range of $63,000 to $66,300.
Ethereum has to escape
After weeks of increasingly constrained price action, Ethereum is nearing a technically significant turning point as it compresses around $1,900. In contrast to Bitcoin, Ethereum has developed a clear converging structure, with support rising beneath the current price and resistance falling toward it.
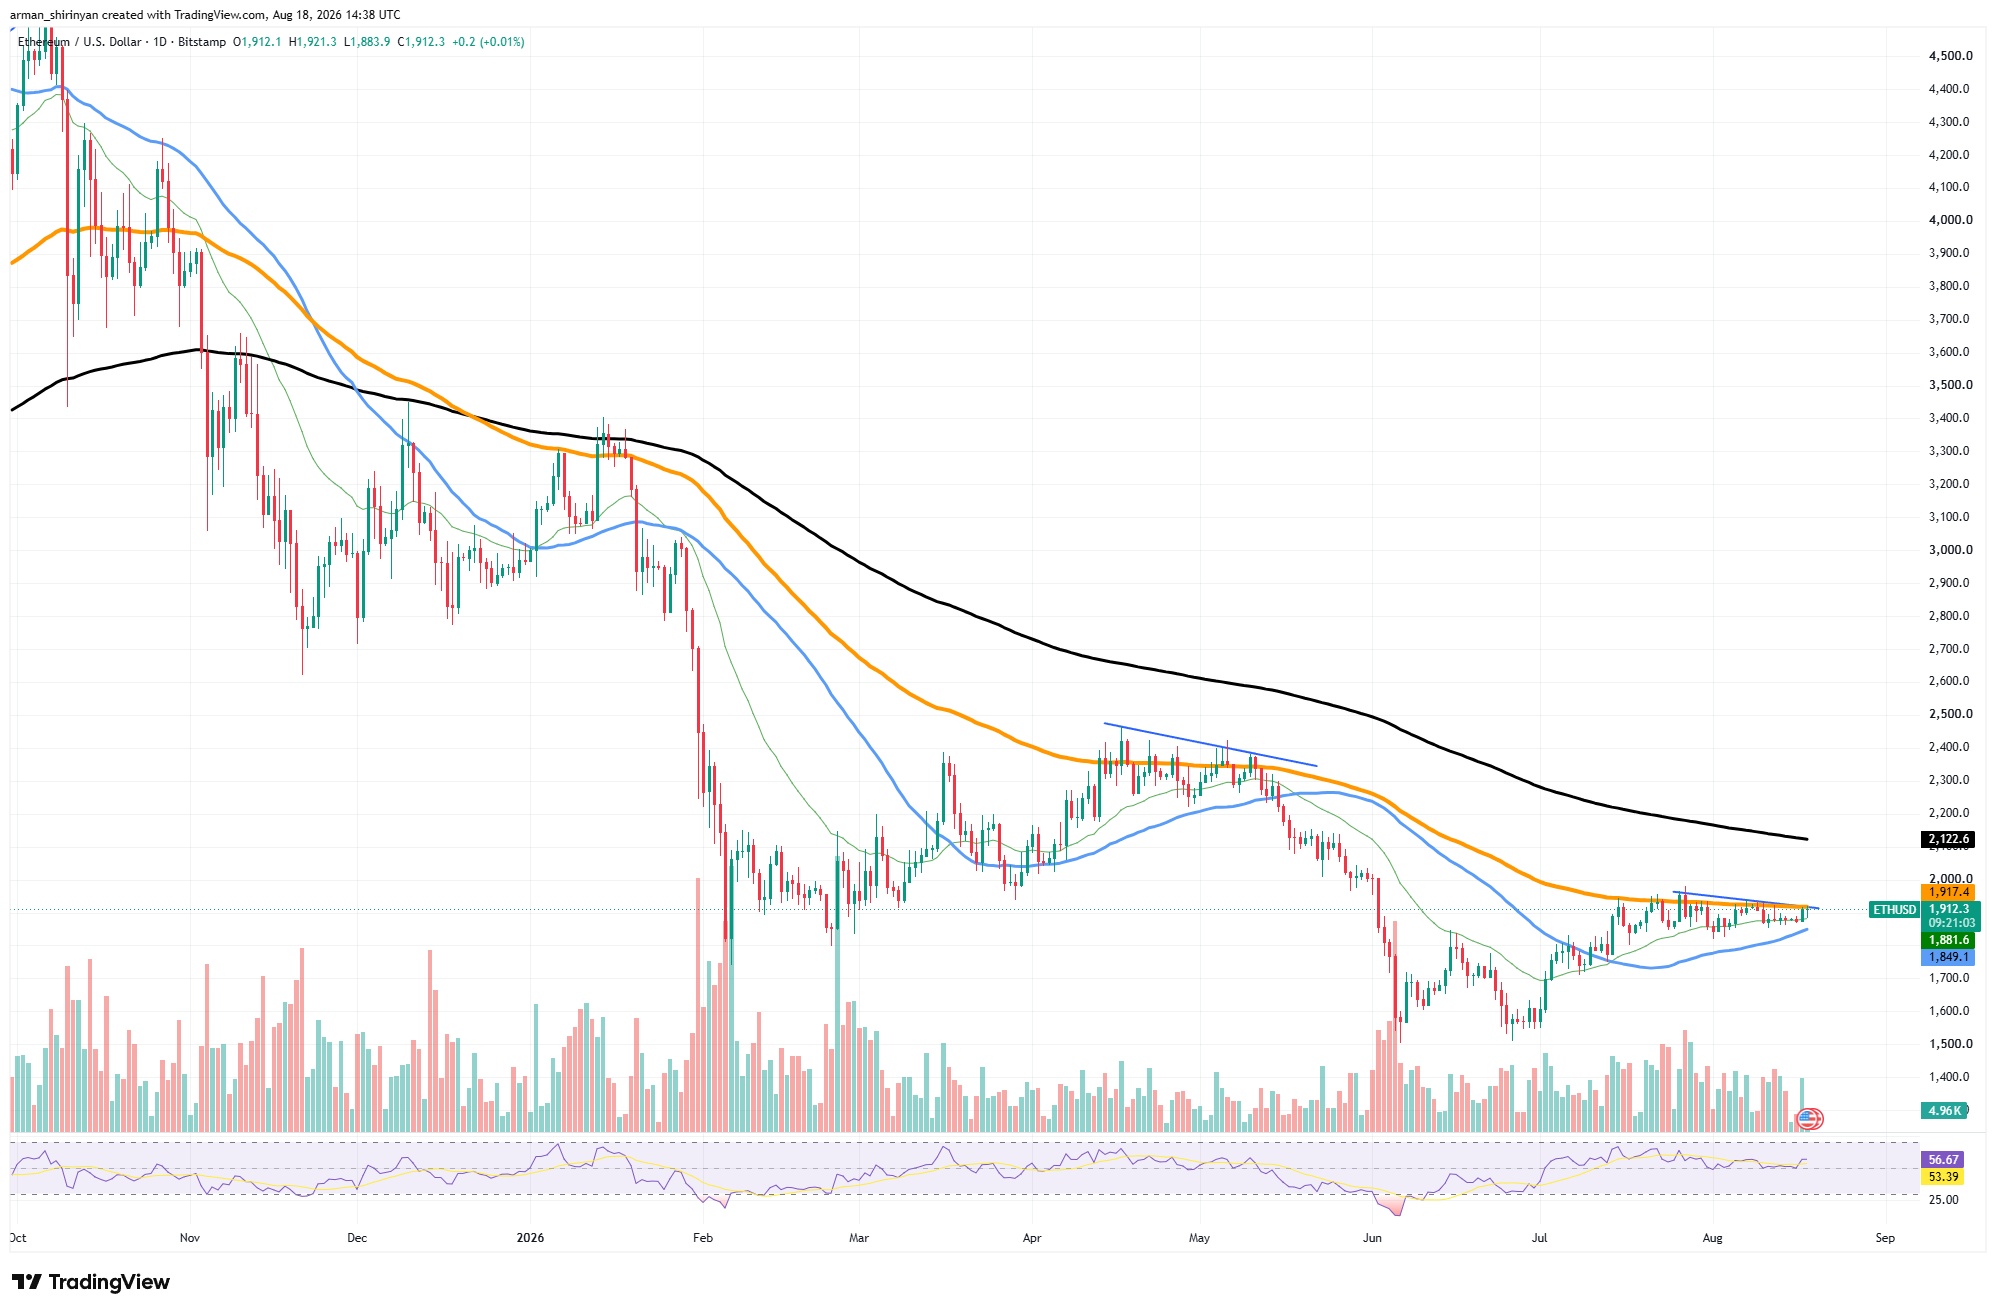
ETH is currently trading at about $1,896. Another significant average is close to $1,849, and the short-term moving average is at about $1,880. Both remain below the market, providing Ethereum with a short-term structure that is somewhat beneficial. This view is supported by the RSI at 53, which indicates a modest bullish momentum advantage without strong buying pressure.
The primary barrier is centered between $1,915 and $1,950. This area is currently crossed by the declining trendline from the July highs, and the intermediate moving average is located close to $1,917. ETH has had difficulty rising above this resistance cluster on several occasions.
You Might Also Like

Therefore, a strong breakout above $1,950 would be more important than the comparatively small percentage move needed to get there. Such a move would invalidate the current compression pattern to the upside, possibly opening the path toward $2,000 and the long-term moving average at $2,120.
Downside risk would remain active if there were no breakout. The first defensive area is located between $1,850 and $1,880 according to the rising support line and moving averages. The recent rebound would be weakened if that cluster were lost, and ETH might move back toward $1,750–$1,800.
At the moment, Ethereum is more likely to experience a technical breakout than a confirmed trend reversal. The $1,850 support and $1,950 resistance levels are especially significant because the narrowing range indicates that the current low-volatility structure is unlikely to last forever.
Dogecoin remains under pressure
Dogecoin is still under intense technical pressure as it continues the downtrend that has dominated the asset for the majority of 2025, trading close to $0.0699. The chart does not yet demonstrate a convincing reversal, despite the fact that the rate of decline has significantly slowed in August.
Right now, DOGE is trading between $0.0707 and $0.0718, directly below its short-term moving averages. This immediately forms a resistance cluster that is only a few percentage points higher than the current price. The first prerequisite for a temporary recovery would be to reclaim it.
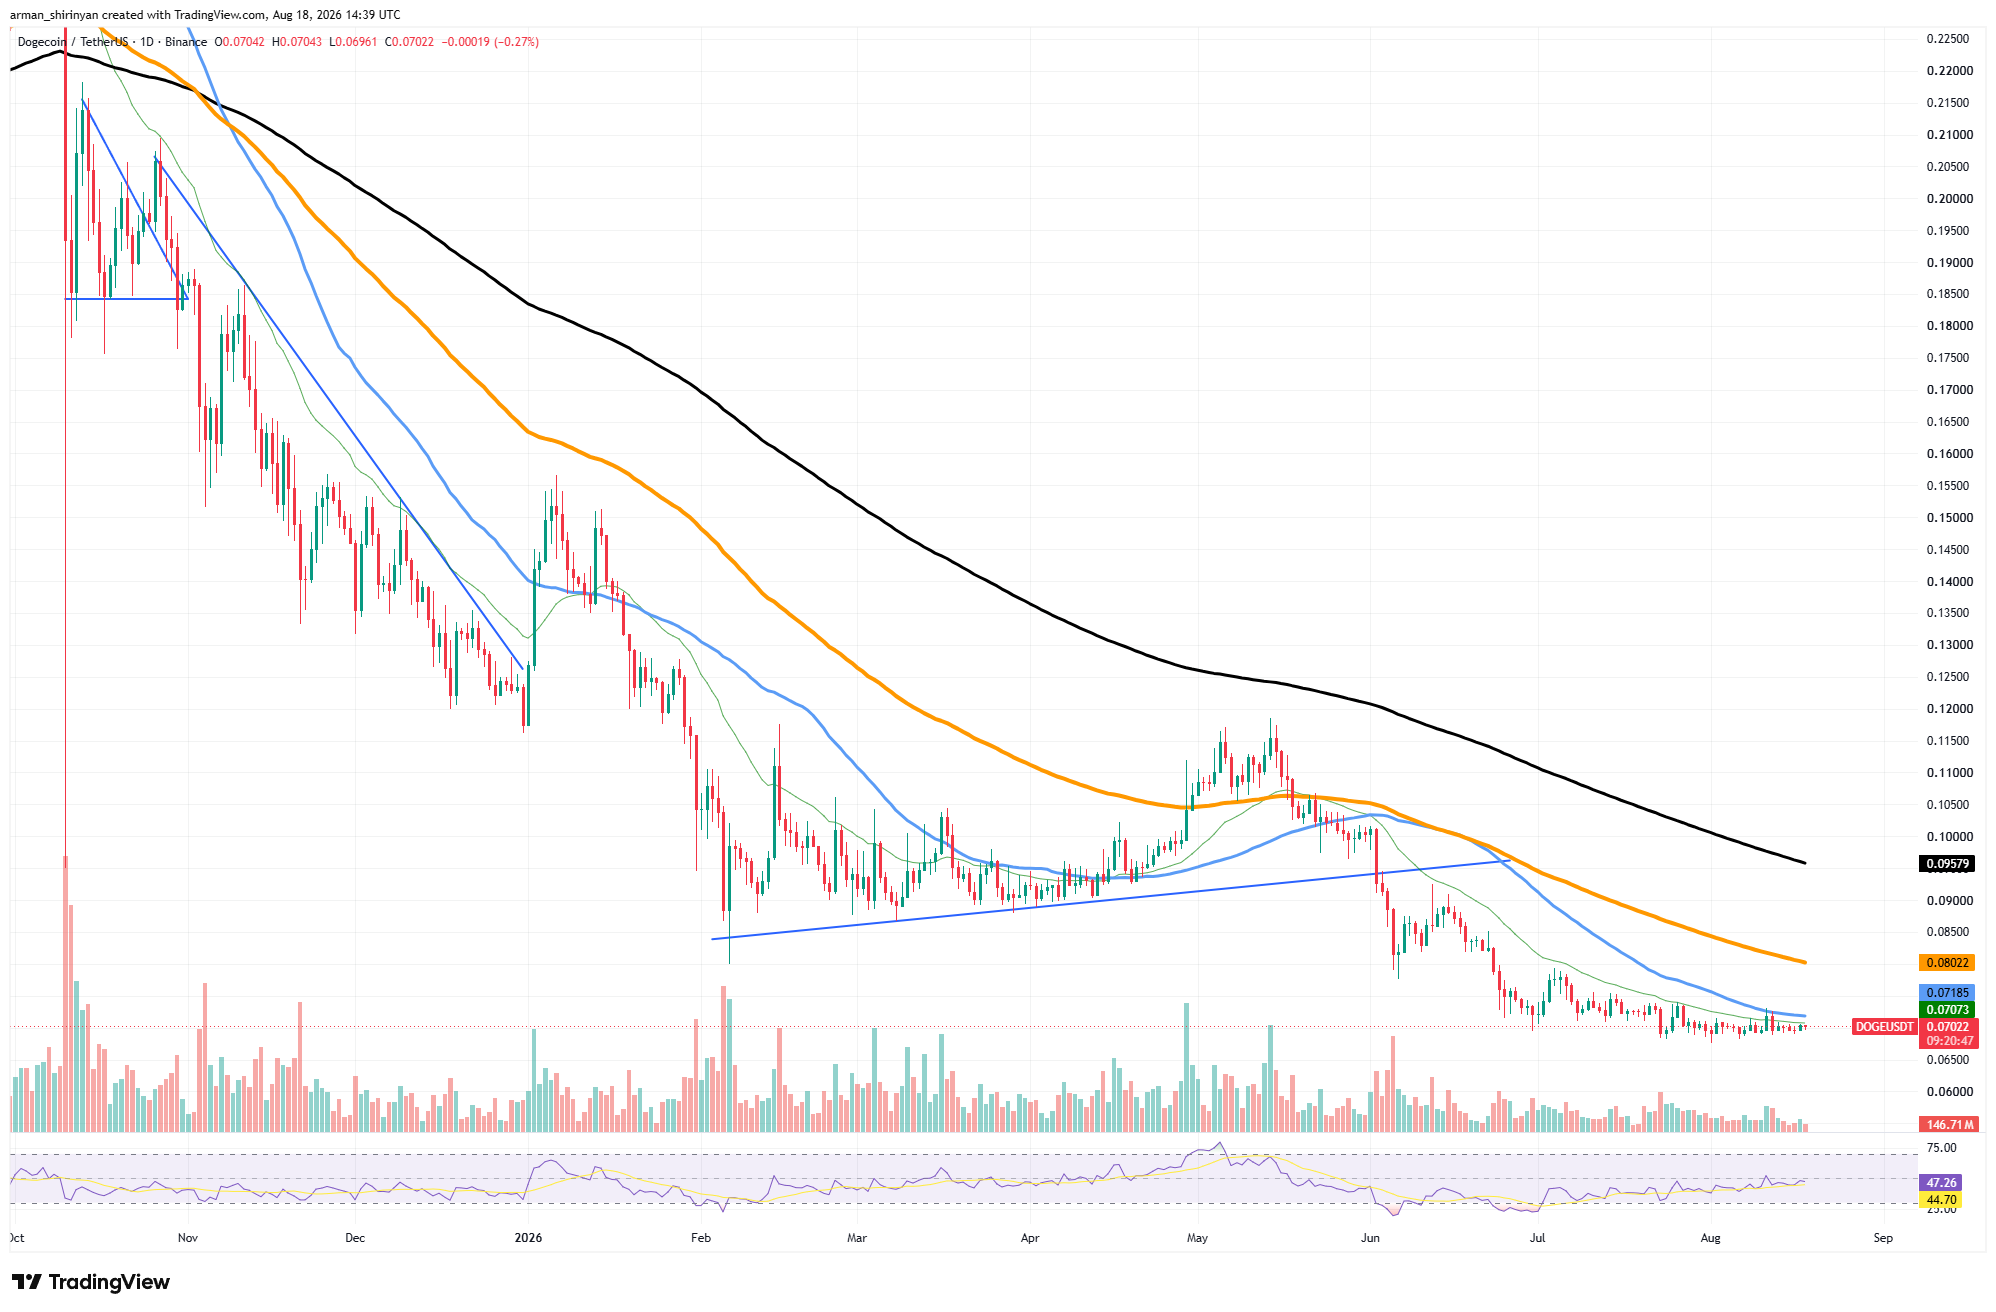
Larger barriers are significantly higher. The long-term average is still around $0.0958, and the intermediate moving average is close to $0.0802. Both exhibit a distinctly bearish hierarchy and are still declining. The rising support structure that emerged between February and June was also breached by DOGE.
The asset moved from above $0.10 to $0.07 as a result of the subsequent decline, and buyers have not yet been able to create a significant higher high. Momentum is weak, though not deeply oversold.
You Might Also Like

With an RSI of about 46, DOGE is below neutral momentum without being significantly oversold. In the event that the current support fails, this allows for further downside. Thus, the $0.068–$0.070 area is crucial. $0.065 and ultimately the psychological $0.060 level could be revealed by a clear breakdown.
XRP loses psychological level
After months of relentless selling, XRP has fallen below the psychological $1 threshold, placing the asset at a crucial juncture. Almost all of the major moving averages are still above the market, and XRP is currently trading at about $0.998. The short-term structure is the immediate issue.
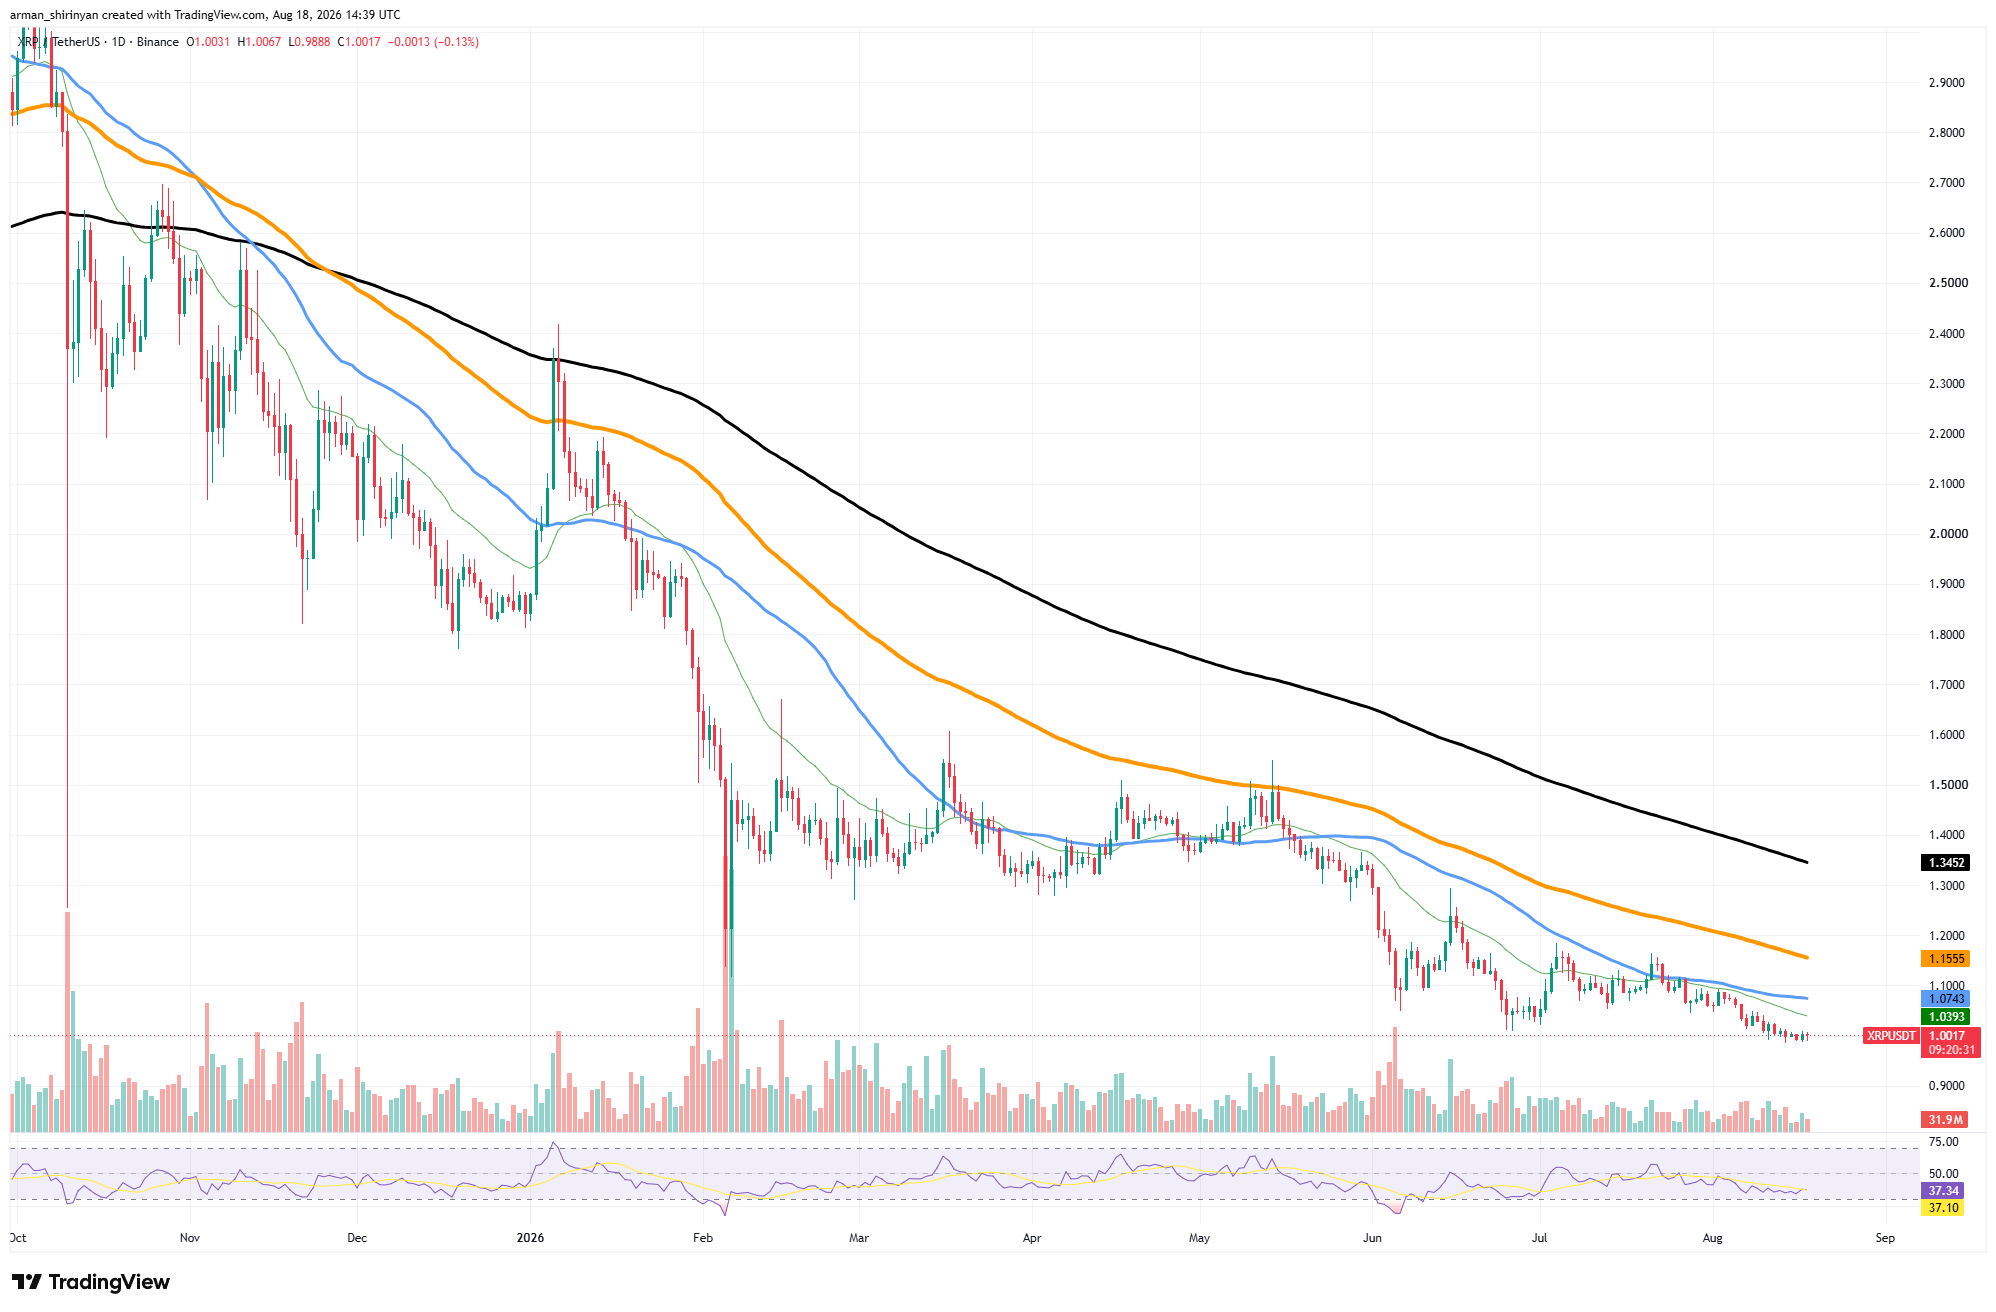
At roughly $1.039, XRP is below the closest moving average, and at roughly $1.074, it is below another important average. Throughout August, both have kept declining, indicating that sellers are still in charge of the short- and intermediate-term trend. The bigger picture is even more challenging.
The long-term moving average is still around $1.345, and the next significant resistance is close to $1.155. Therefore, before the larger bearish structure could be deemed invalid, XRP would need to make a significant recovery. There is little indication of an imminent reversal in momentum.
You Might Also Like

XRP is comparatively near oversold territory, but it is still above the traditional 30 threshold, with an RSI of about 36.5. The RSI reading alone does not offer a reliable bottom signal because persistent downtrends can keep it low for extended periods of time. Now, the $1 level serves as the direct battlefield.
The most recent breakdown could become a failed bearish move if price is quickly recovered above it and then moves through $1.04. Recovering $1.07 would offer much more convincing proof that buyers are returning. But if $1 isn’t recovered, XRP could drop even further. The next areas to watch are roughly $0.95 and $0.90, where there isn’t much established support.
