


With the most recent attempt at stabilization failing to result in a significant trend reversal, XRP is still trapped in a strong bearish structure. After moving sideways for the majority of July and the first part of August, the asset now trades at $1.03, perilously close to the psychologically significant $1 threshold.
XRP’s path is unclear
The primary issue continues to be the moving-average structure. XRP is below each of the daily chart’s four averages. The shorter averages at roughly $1.07 and $1.09 provide immediate resistance, which is followed by much stronger resistance at roughly $1.18. At about $1.37, the long-term moving average is still significantly higher.
The general bearish setup is maintained by the negative slopes of all major averages. Sellers are also favored by momentum. The daily RSI is now below its signal average of 41.7, at about 38.3.
Since XRP is not yet significantly oversold, there may be more declines before momentum reaches a clear exhaustion point. As a result, the critical support zone is between $1.00 and $1.03. Losing it would expose $0.95 and $0.90 and eliminate the last remaining psychological support.
In order to recover, XRP must first recover $1.07–$1.09. A significant structural improvement would be represented by a move above $1.18.
Zcash enters dynamic support
Zcash’s technical picture is significantly better. Despite recent consolidation, ZEC is still above every significant moving average on the daily chart, trading at about $505. The closest dynamic support is located at about $497, and the moving averages are at about $481 and $469.
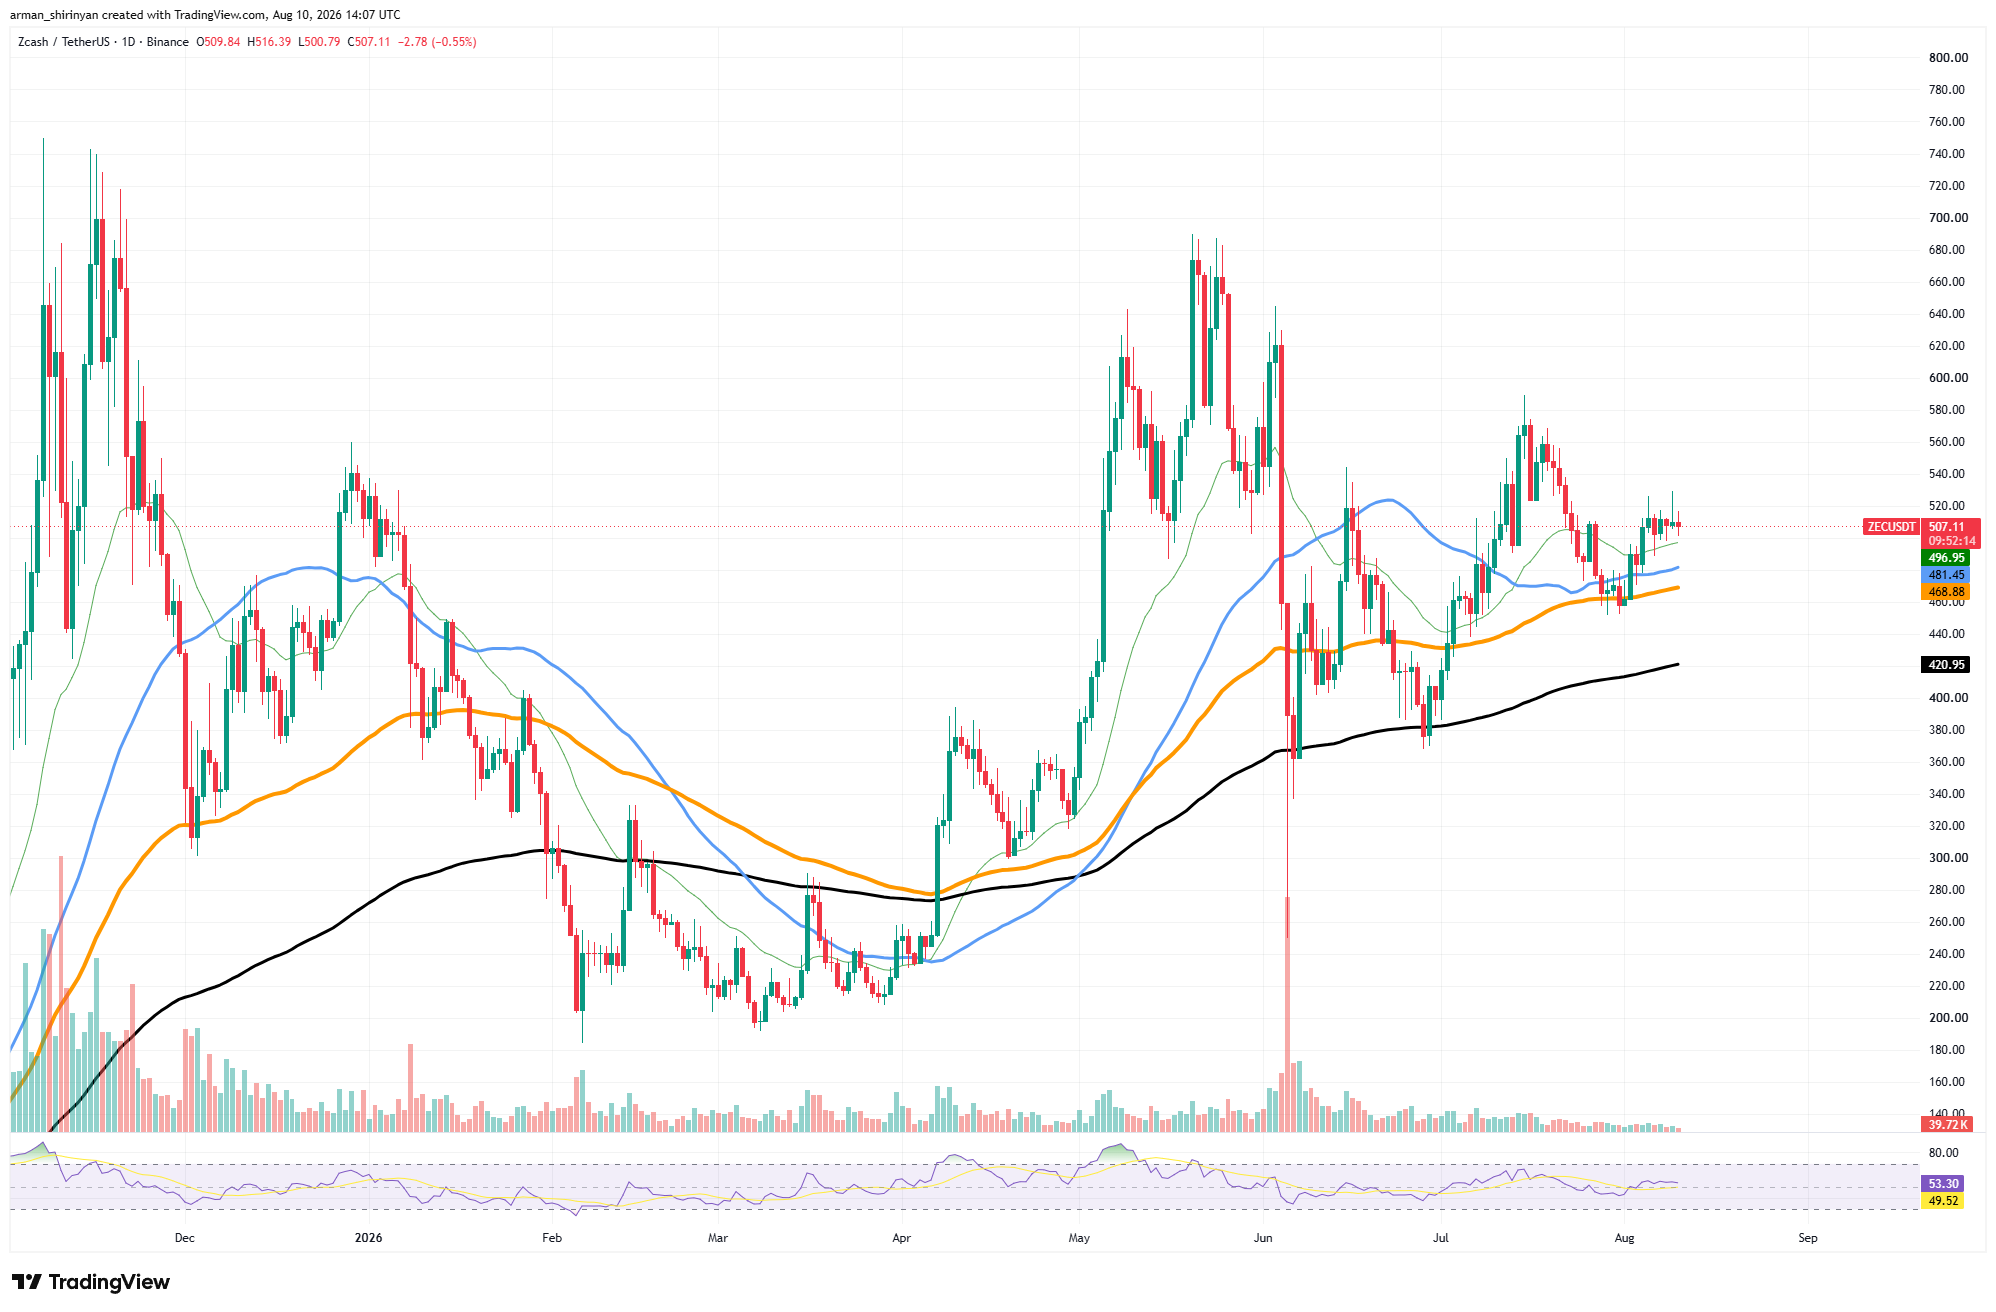
More significantly, the long-term average at $421 is still rising. As long as buyers protect the $469–$481 range, this alignment makes ZEC’s medium-term structure constructive. Rather than being overheated, momentum is neutral. The RSI is close to 52.6, just above its 49.5 signal line.
This allows ZEC to travel in any direction without the setup being hampered by an extreme momentum reading. Establishing a strong breakout above the $510–$520 range is the current challenge.
Recent candles indicate persistent reluctance in this area. Clearing it could reopen the $540–$560 range, where selling pressure was present during the previous July rally. After that, the next significant resistance is about $580. On the other hand, a decline below $469 would put the current bullish structure in jeopardy, while a loss of $497 would weaken the immediate setup.
ZEC is still technically superior to XRP for the time being. Although the price is above rising long-term support, buyers still need a breakout above $520 to resume significant upward momentum.
Can Ethereum (ETH) finally recover?
Although Ethereum is making an effort to create a recovery structure around $1,900, the daily chart still shows ETH at a significant technical barrier. The asset is trading close to $1,905, almost exactly in opposition to the moving average at $1,923, which has consistently constrained upside since the June collapse.
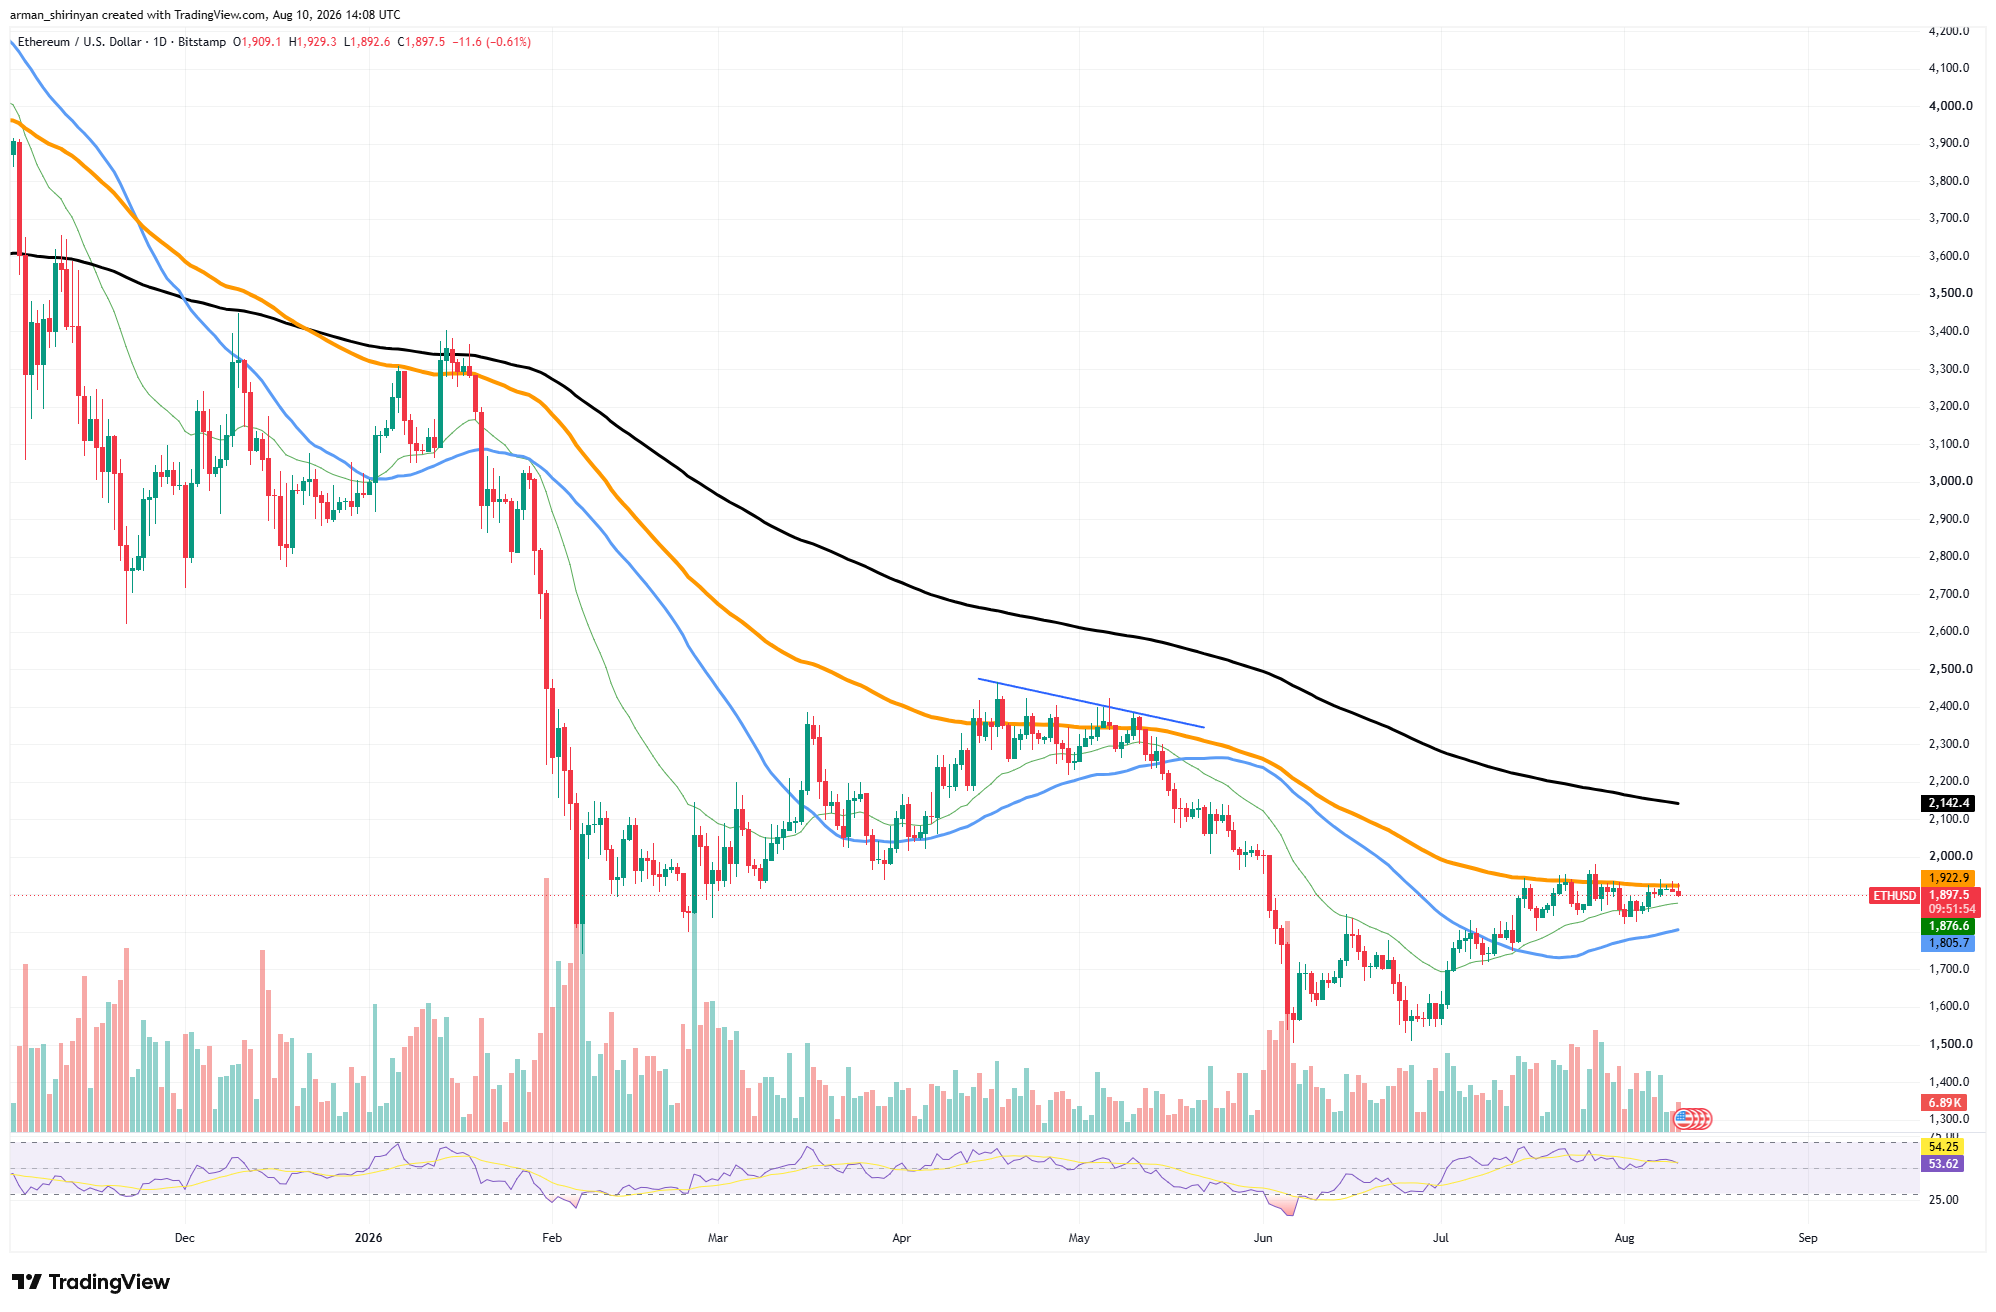
Since the June low of about $1,550, short-term conditions have significantly improved. Since then, ETH has experienced higher lows and recovered the shorter moving averages at roughly $1,877 and $1,806. The former now serves as immediate support, but if the current consolidation breaks downward, the $1,800–$1,805 range is a more crucial level.
Although it has recently flattened, the RSI is currently at 54.8, above the neutral 50 level. This is consistent with price action: buyers are still in some control, but they have not created enough momentum to cause a breakout.
A daily close above $1,923–$1,950 is the first prerequisite. The psychological $2,000 level and, eventually, the long-term moving average around $2,143 could be reached if this area is cleared. Until then, ETH is still attempting to recover within a much more expansive bearish structure.
Bitcoin remains in consolidation
With increasingly compressed price action, Bitcoin is still consolidating around $64,800, indicating that the market is getting close to making another directional decision. After rising from roughly $58,000, Bitcoin has been able to maintain a relatively stable support structure by staying above its shorter moving averages around $64,239 and $63,343.
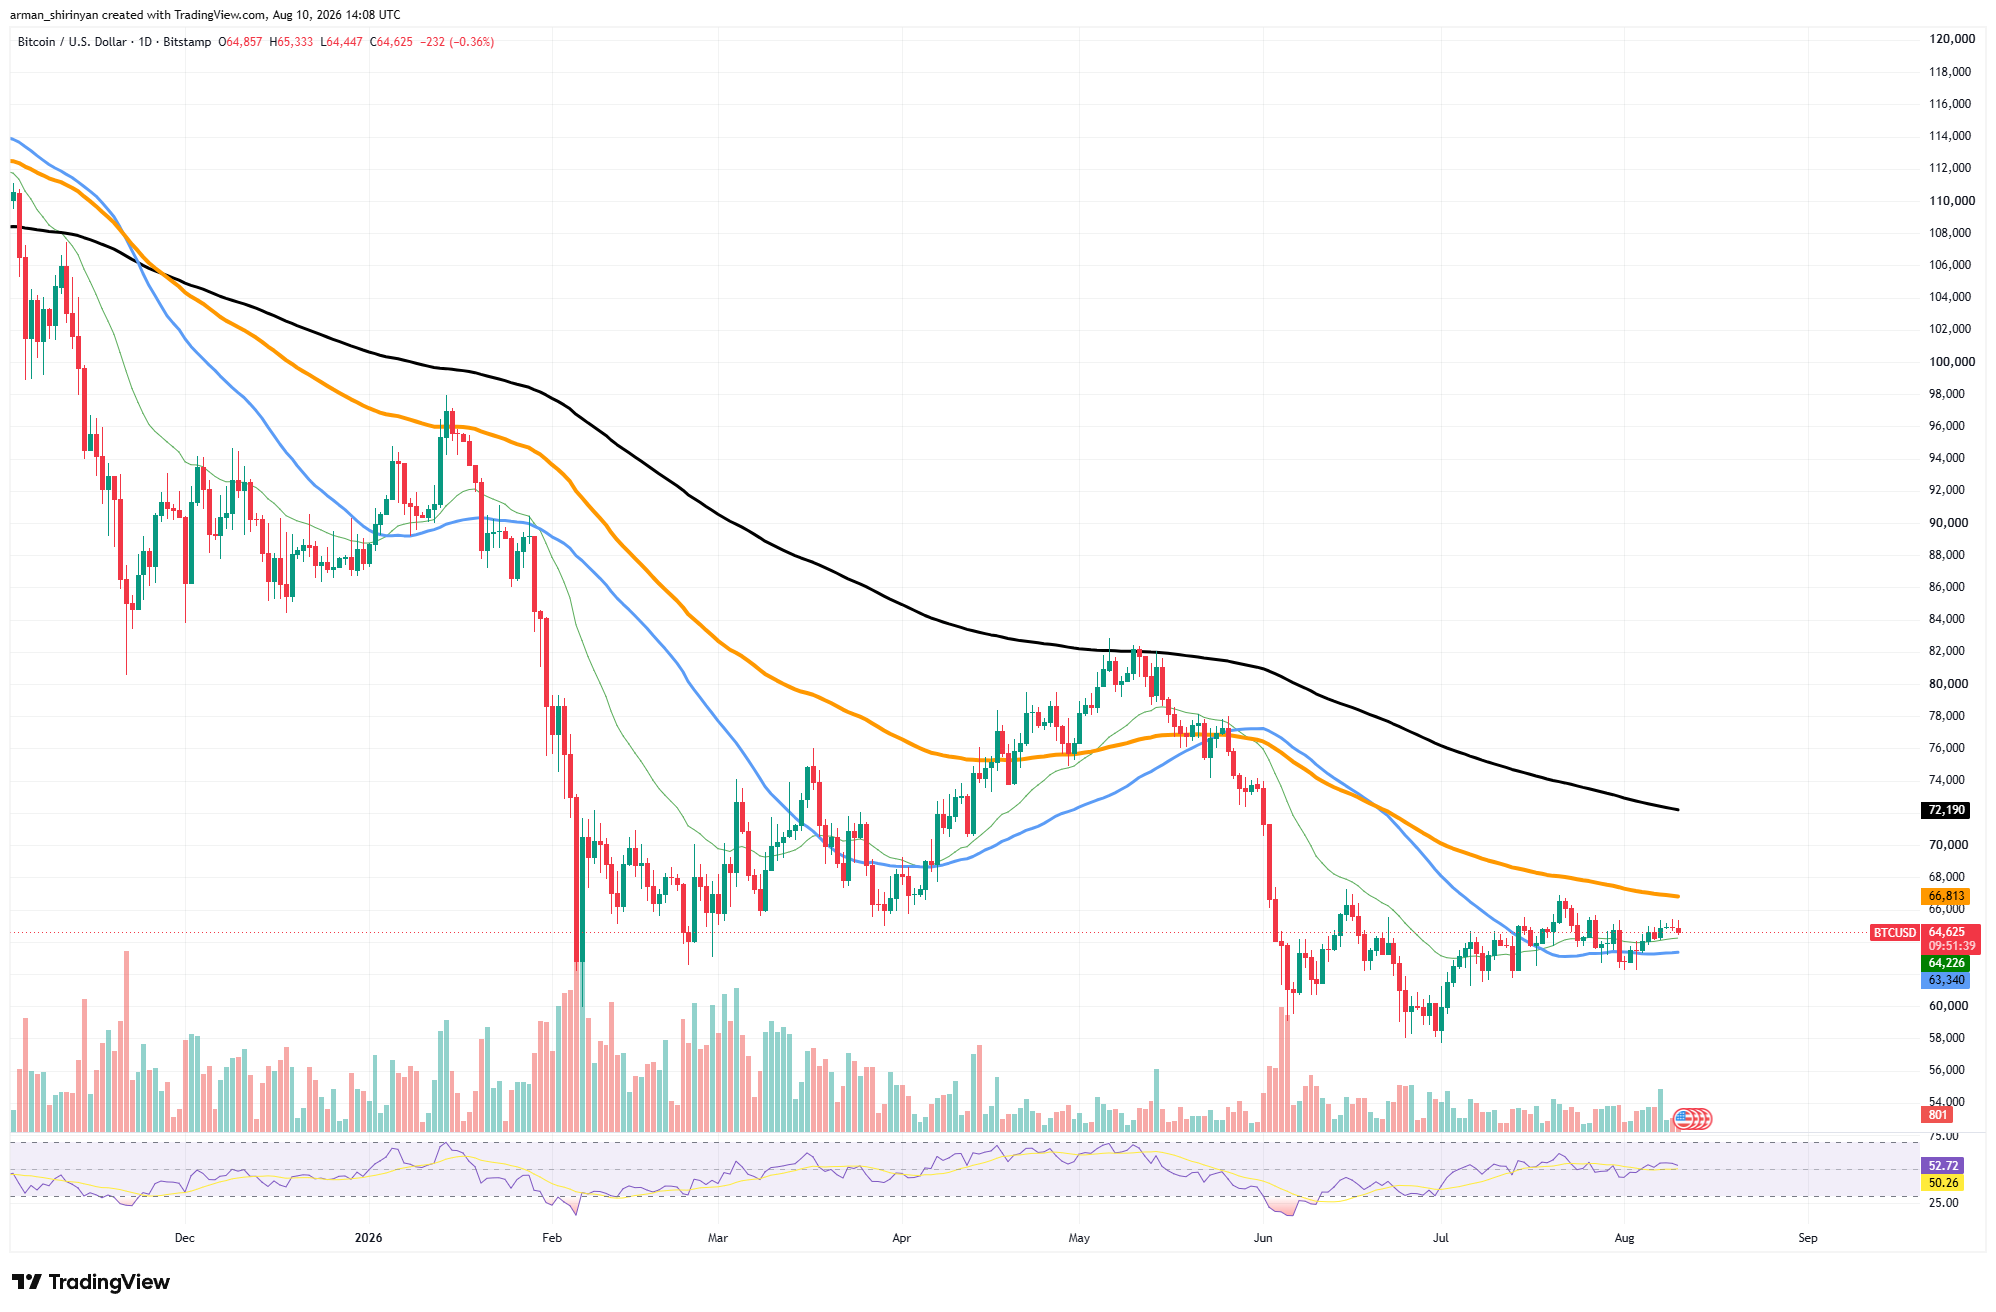
Additionally, the RSI at 53.9 is still somewhat bullish without getting close to overbought territory. The overhead resistance is the issue. The $66,000–$67,000 range is the current barrier for Bitcoin since it is still below the falling moving average at $66,817.
The much stronger long-term average, at about $72,192, is located above that. The recovery would be strengthened and $70,000–$72,200 might be back in play with a strong break above $66,800.
But losing $63,300 would expose $60,000, followed by the June bottom at about $58,000, undermining the current higher-low structure. Bitcoin is not yet confirming a bullish reversal or breaking down. The larger trend will be limited until Bitcoin can firmly reclaim $66,800 and start challenging the $72,000 area, even though short-term momentum has recovered.
