


After rising from local lows, Shiba Inu has made an impressive short-term comeback, but its next challenge might be much more challenging. The meme coin is currently testing the 100-day EMA, which has frequently served as a ceiling during the wider decline, after rising back above its 50-day moving average.
SHIB’s recovery fades away
Whether the most recent rally has enough momentum to continue will probably depend on SHIB’s ability to recapture this resistance. SHIB recently saw a dramatic increase in buying volume on the daily chart, resulting in one of the strongest green candles in weeks. The price passed through a number of resistance levels as a result of that move, and the RSI momentarily rose above 70, indicating overbought conditions.
Since then, the asset has somewhat cooled off, and the RSI has eased toward the high 50s, indicating that excessive bullish momentum has already been eliminated without causing a significant sell-off. The technical picture is getting better than it was in earlier attempts. Following months of decline, SHIB is currently trading above both its 26-day and 50-day exponential moving averages, which have begun to level off.
The 100-day EMA, which is presently at the $0.00000500 level, is still the most significant barrier, though. Although buyers are still active, there hasn’t been a clear breakout as the price is consolidating directly beneath it.
More than just another resistance break would be represented by a successful daily close above the 100-day EMA. It would raise SHIB above all of its shorter-term moving averages and change the direction of the market structure to one that is more optimistic.
The long-term 200-day EMA, which is still significantly higher and still sloping downward, could be reached by more momentum traders entering the market as a result of that scenario. The crucial element will be volume. Trading activity increased significantly during the recent rally, but follow-through buying has been less frequent.
The likelihood of breaking through the 100-day EMA rises dramatically if buyers return with another wave of high volume. However, failure at current levels would probably push SHIB back toward the 50-day EMA, which is now the first significant support.
Losing that area could transform the recent breakout into another brief rally within the larger bearish trend, while holding it would protect the developing bullish structure. As of right now, it looks like SHIB is getting close to one of its most significant technical tests in recent months.
XRP’s recovery attempt
It seems that XRP is encountering a well-known challenge in its most recent attempt at recovery. The asset has risen back toward a group of moving averages that have consistently rejected bullish momentum during the wider downtrend after rising from recent lows. Right now, XRP is trading slightly below the 50-day and 100-day exponential moving averages, setting up what might prove to be the pivotal moment in the recovery.
After weeks of persistent weakness, buyers intervened, and the daily chart shows XRP rising from the support area around $1.00. The price eventually broke higher with a discernible increase in volume, making the bounce initially encouraging, especially as it formed a small ascending triangle.
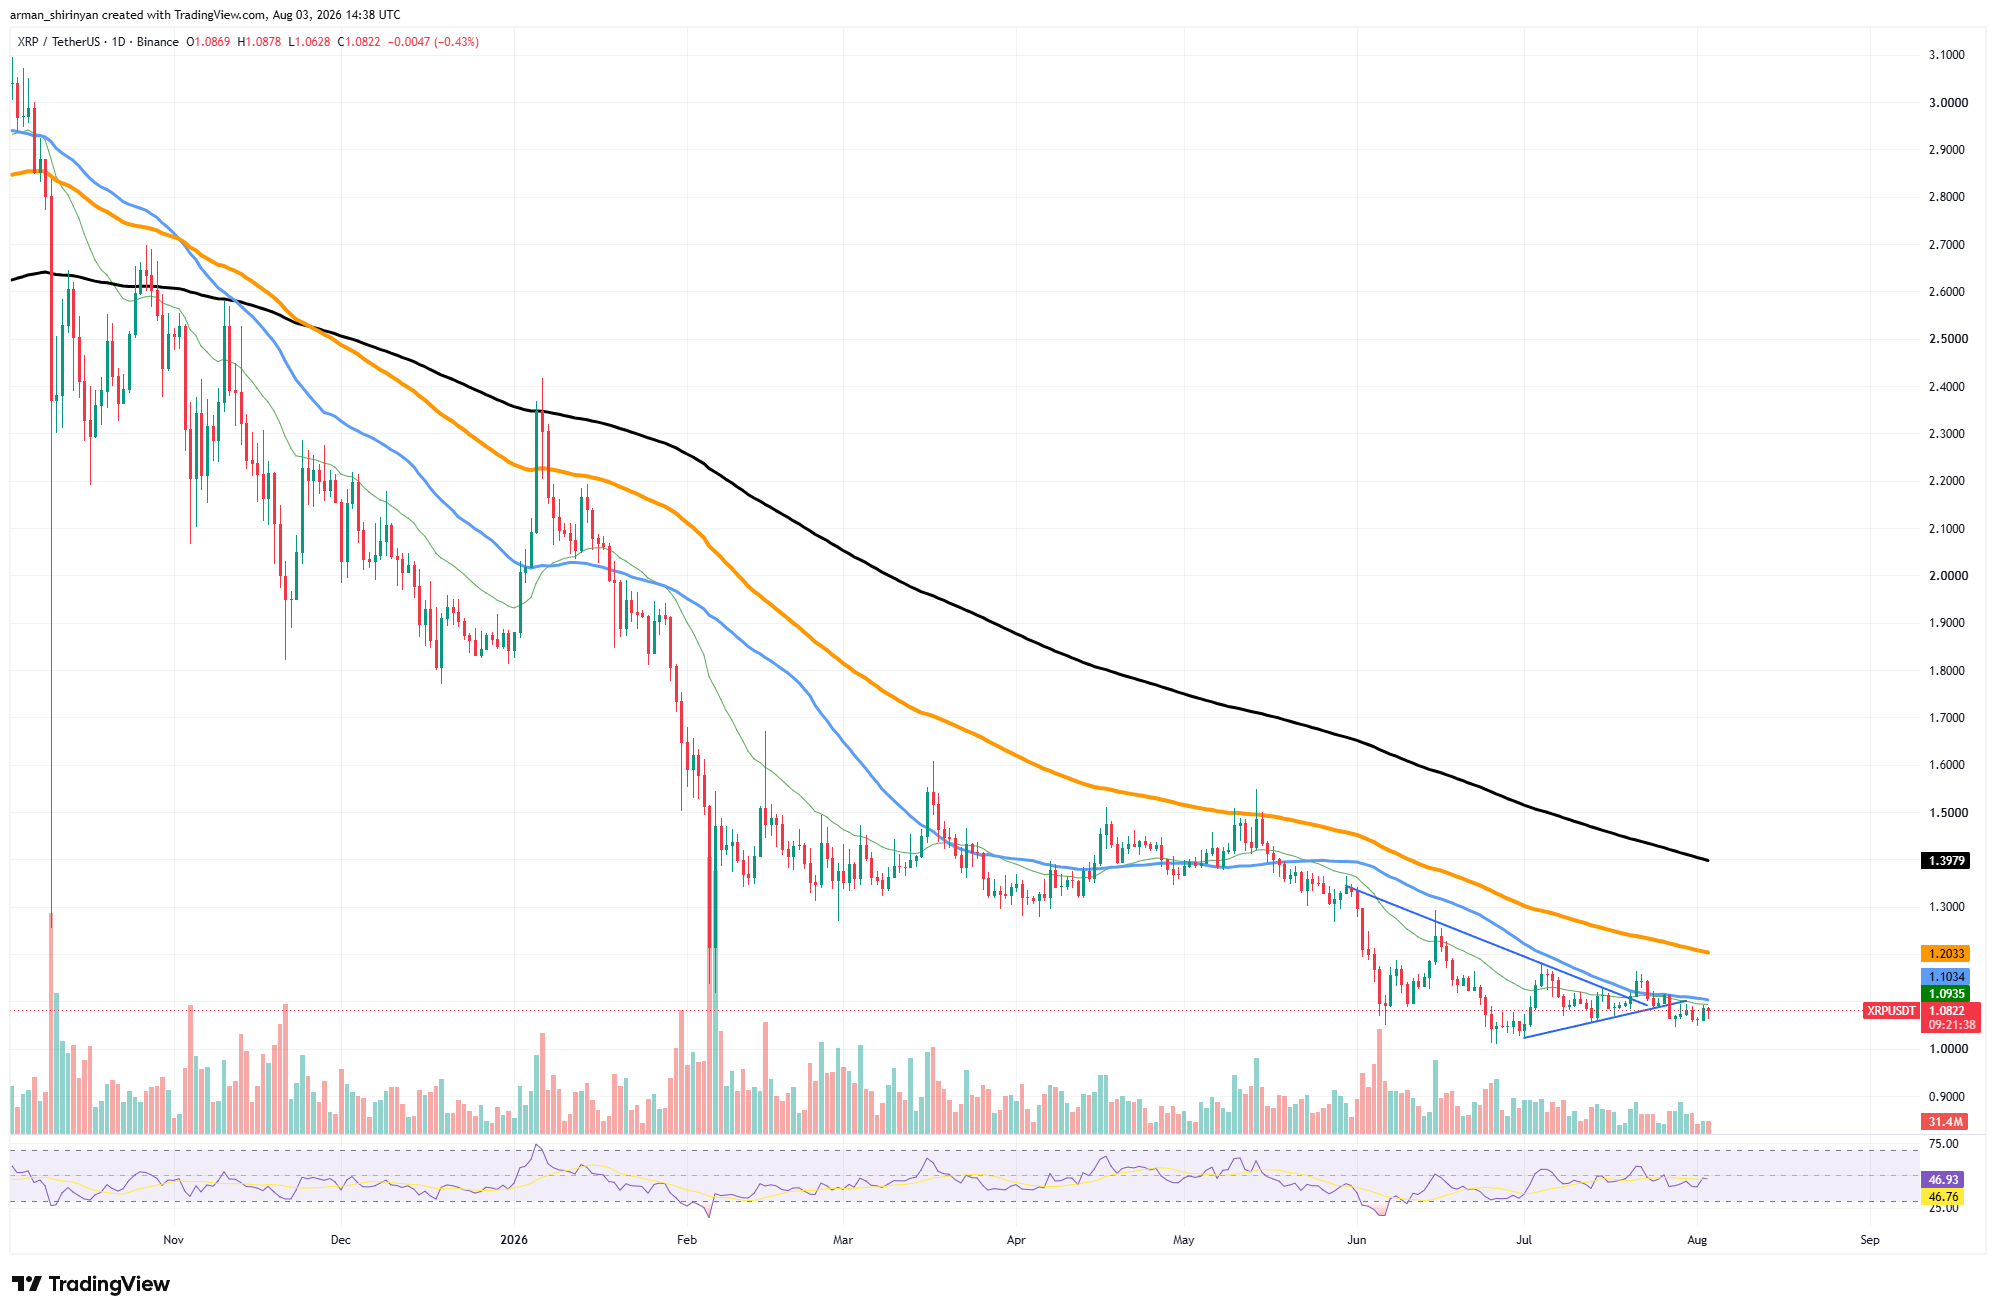
XRP briefly surpassed a number of short-term resistance levels as a result of that breakout, but the rally soon lost steam as it approached the moving-average cluster at $1.09-$1.10. Technically, the situation is still unclear. While the 200-day moving average is still much higher at $1.40 and is still sloping downward, XRP is still stuck below the declining 100-day EMA.
Despite the recent recovery, that long-term trend demonstrates that sellers continue to dominate the overall market. Additionally, momentum indicators point to hesitation as opposed to strength. Although buying pressure has improved from oversold conditions, the Relative Strength Index is still far from indicating a strong bullish trend, sitting around the neutral 45-46 range.
In contrast to the recent movement in a number of other large-cap cryptocurrencies, XRP has not produced enough momentum to move the RSI above 50 into bullish territory. The crucial resistance zone is currently the region around $1.10. It is a technically important barrier because it combines past price congestion with the declining 50-day and 100-day moving averages.
The outlook for XRP would be significantly improved by a decisive daily close above this area, which might draw attention to the next resistance near the 200-day EMA. However, XRP runs the risk of going back to the psychological $1.00 support if buyers fail once more. A significant portion of the recent recovery would be rendered invalid if that level were lost, leaving the asset vulnerable to a further decline.
Bitcoin is weakening
Once again, Bitcoin is displaying signs of weakness as its attempt to recover starts to falter. The biggest cryptocurrency recovered a number of short-term moving averages after rising from June lows, giving rise to expectations that a longer-term rally was beginning. But as Bitcoin struggles to stay above the 50-day exponential moving average and sellers regain control, those hopes have faded.
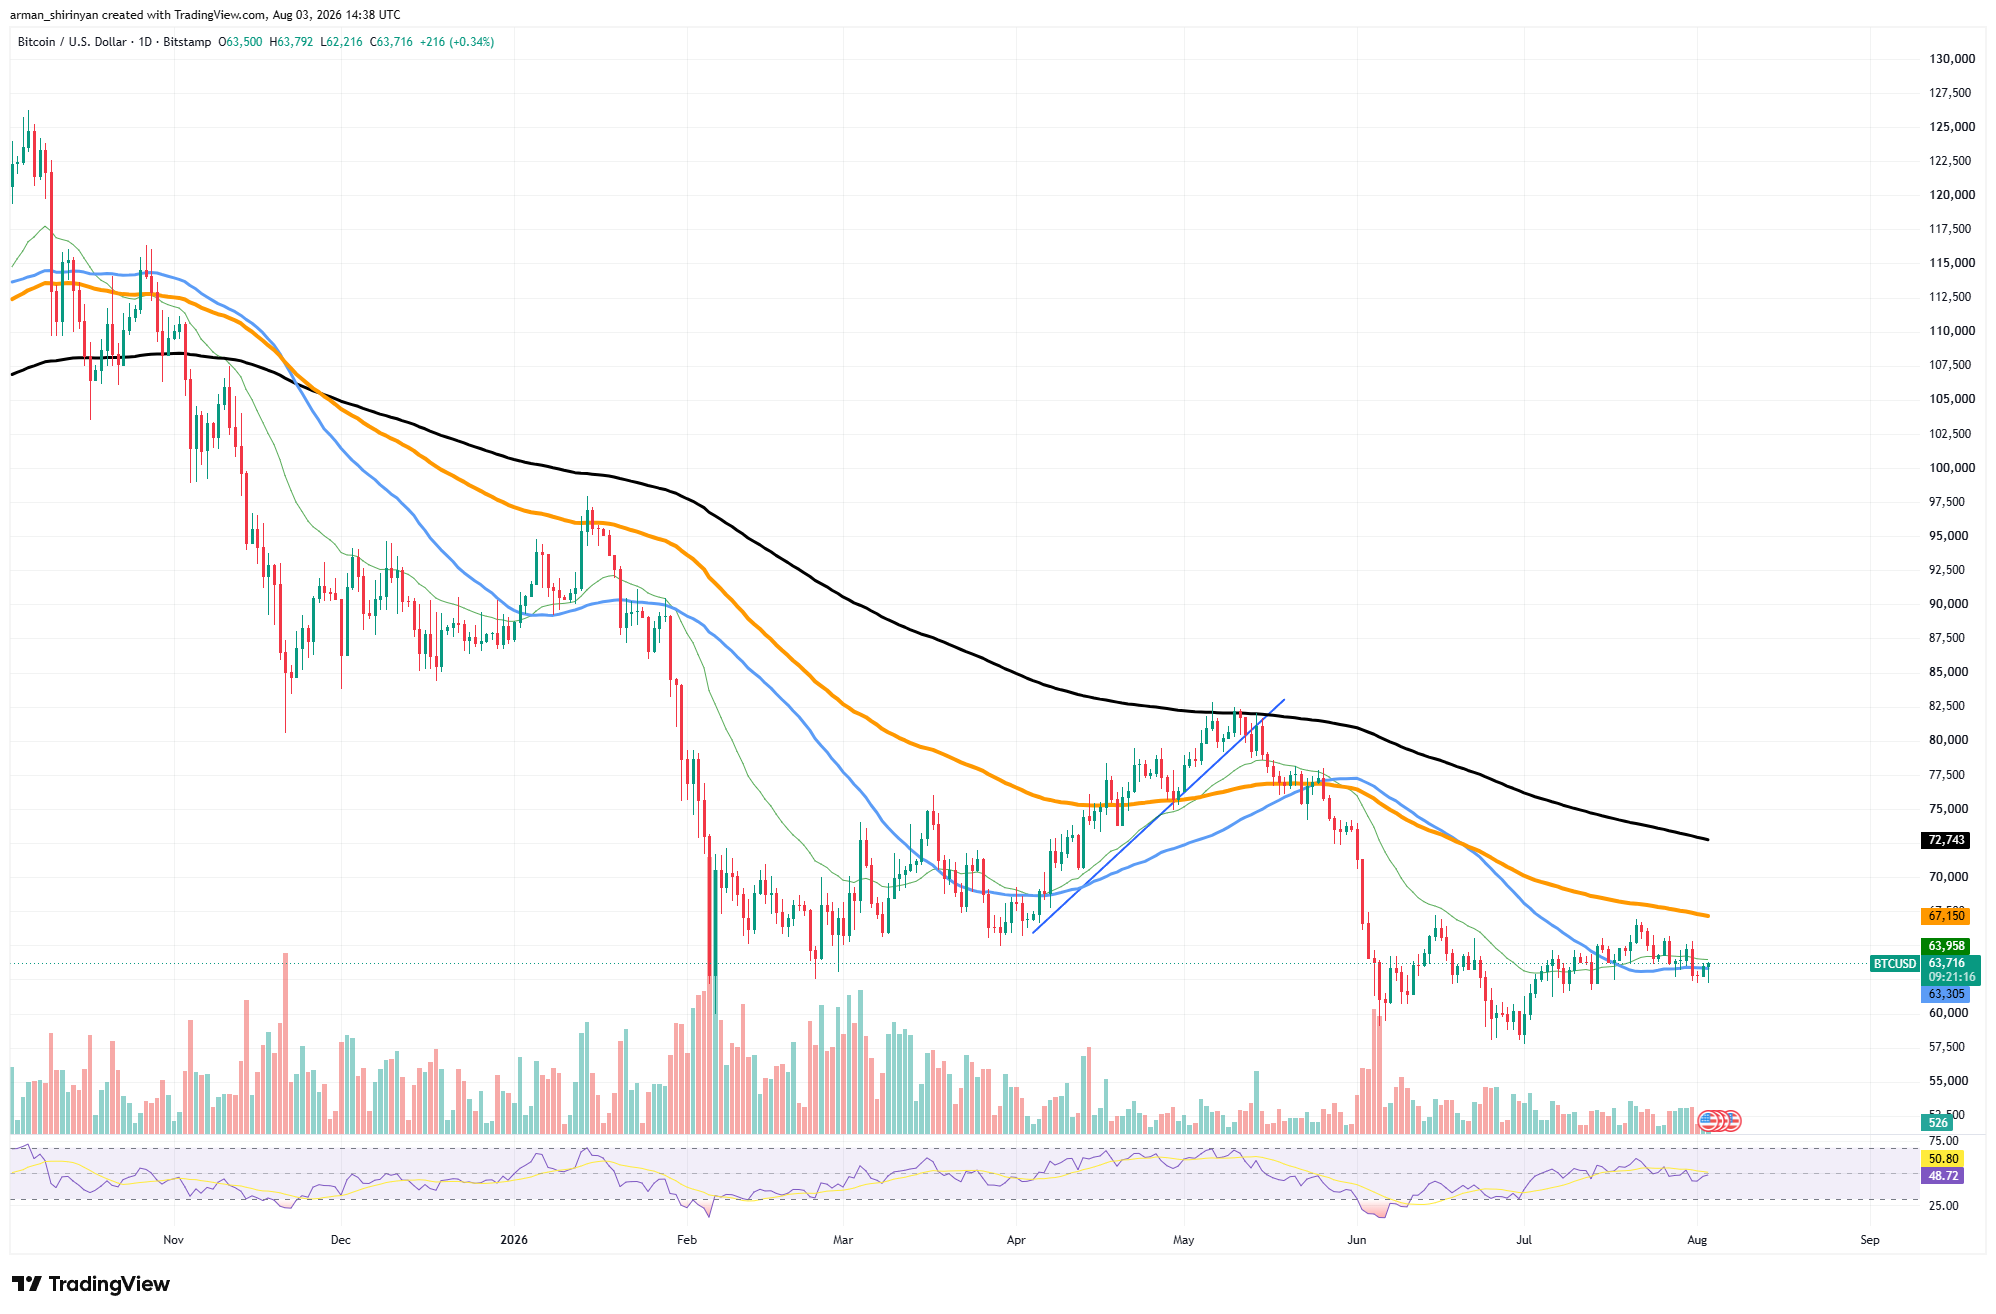
The daily chart shows that the market has entered yet another phase of uncertainty. Squeezed between close support and resistance, Bitcoin is currently trading around $63,000 and has not been able to establish a strong trend. The asset has been drifting sideways since it was rejected by the 50-day EMA, and every attempt at recovery has resulted in lower highs.
The larger technical structure may be the most significant issue. The 200-day EMA is still trending lower at about $72,000, while the 100-day EMA is still significantly above the current price at about $67,000.
Despite a few brief relief rallies over the past two months, the overall market structure is still bearish until Bitcoin can recover those long-term resistance levels.
While the lack of oversold conditions allows for further downside if sellers increase their activity, that decline indicates that buying pressure has significantly lessened. The volume of trades also indicates an increase in uncertainty.
Although there was significant buying when Bitcoin recovered from its June lows, participation in recent sessions has decreased. Bulls find it more and more difficult to overcome the resistance formed by the declining moving averages in the absence of fresh inflows. The immediate support is still in the $60,000-61,000 range from a technical perspective.
A collapse below that range might put Bitcoin through another test of the June lows and possibly set off a more widespread sell-off in the digital asset market. On the plus side, buyers must first get past the resistance grouped around the 50-day moving average in order to regain the 100-day EMA, which would greatly enhance market sentiment.
