


After rising from the $1.05 support zone, XRP is making one of its best attempts at recovery in weeks. The asset has quickly gained momentum and is currently testing the region surrounding the 50-day EMA, which has served as a ceiling during the current decline.
Despite the recovery, XRP’s technical market structure is still bearish. The asset broke out of a descending triangle pattern earlier in the year, and it spent the majority of June setting lower highs and lower lows. But the recent surge has raised the RSI above 50, indicating that bullish momentum is at last coming back. The 50-day moving average, which is close to $1.19, is the important level to monitor.
The first significant technical win for bulls in months would come from a breakout above this resistance, which could pave the way to the $1.28 area, where the 100-day EMA is currently located. The longer-term downtrend structure would then provide more resistance for XRP. The recovery has seen an increase in volume, which gives the move more legitimacy.
However, once XRP hits significant resistance levels, buyers still have to demonstrate that they can maintain demand. XRP may swiftly return to support at $1.10 if the current rally stalls below the 50-day EMA. Momentum is currently in favor of the bulls, but confirmation is still required before discussing a more significant trend reversal.
Shiba Inu is a weak link
Despite a slight recovery from recent lows, Shiba Inu is still among the weakest large-cap coins on the market. After recovering from a selloff that brought it near the crucial $0.0000040 support level, the meme coin is currently trading close to $0.0000043. The big picture is still negative.
You Might Also Like

Sellers continue to dominate the market as SHIB continues to trade below its 50-, 100-, and 200-day moving averages. The asset broke out of a rising wedge formation earlier this year, and the subsequent decline indicated that the long-term downtrend would continue. Over the past few days, SHIB has avoided a total collapse thanks to the emergence of a small recovery structure.
The RSI is getting closer to neutral levels after rising from oversold territory, indicating that selling pressure is lessening. However, the bounce remains relatively weak compared to previous recovery attempts. Near $0.0000049, the location of the 50-day EMA, is the first significant barrier. Bulls must reclaim the significant psychological barrier at $0.0000050 above that in order to alter market sentiment.
SHIB runs the risk of turning the current rebound into another lower high in the absence of greater volume. The token may return to the $0.0000040 support zone if buyers are unable to break through nearby resistance. However, a breakout above $0.0000050 would greatly enhance the technical outlook and might even start a more extensive recovery phase.
Bitcoin’s attempt to regain strength
After one of the biggest selloffs in recent months, Bitcoin is making an effort to rebound. Before buyers intervened and sparked a relief rally, Bitcoin fell toward the $58,000–$60,000 support zone following a breakdown from the $80,000 region. Bitcoin has returned above the 20-day EMA as a result of the rebound, indicating that short-term momentum is strengthening.
The overall technical picture is still difficult, though. The 50-day and 100-day moving averages, which are located close to $66,700 and $69,500, respectively, are still above BTC. These levels are now the main cluster of resistance that bulls have to get past. The recent rebound also comes after a sharp upward trend that propelled Bitcoin through April and the first part of May was declared invalid.
You Might Also Like

Selling pressure increased after that trendline broke, resulting in a series of liquidations that altered the structure of the market. Early signs of improvement are being seen in momentum indicators. After spending some time in oversold territory, the RSI has recovered toward the neutral 50 zone, indicating that bearish pressure is subsiding.
However, buyers still have to demonstrate that the recovery has sufficient strength, as the indicator is still far from overbought conditions. Watching the $66,000–$70,000 range is crucial.
A breakout above that range would put Bitcoin back above its medium-term trend indicators and might lead to a move in the direction of the 200-day moving average at about $75,000. However, another test of the $60,000 support area might result if resistance is not overcome. Rather than a verified reversal, Bitcoin is stabilizing. Bulls still face formidable technical obstacles, but the recovery is encouraging.
Dogecoin bounces
After finding support around $0.070, Dogecoin is still trapped inside a larger bearish structure that has dominated trading all year. DOGE entered a sharp correction that drove the asset to new yearly lows after losing a significant rising support trendline that had been in place since February. The token’s price is rising back toward the 20-day EMA as a result of the recent bounce, which has helped it regain some lost ground.
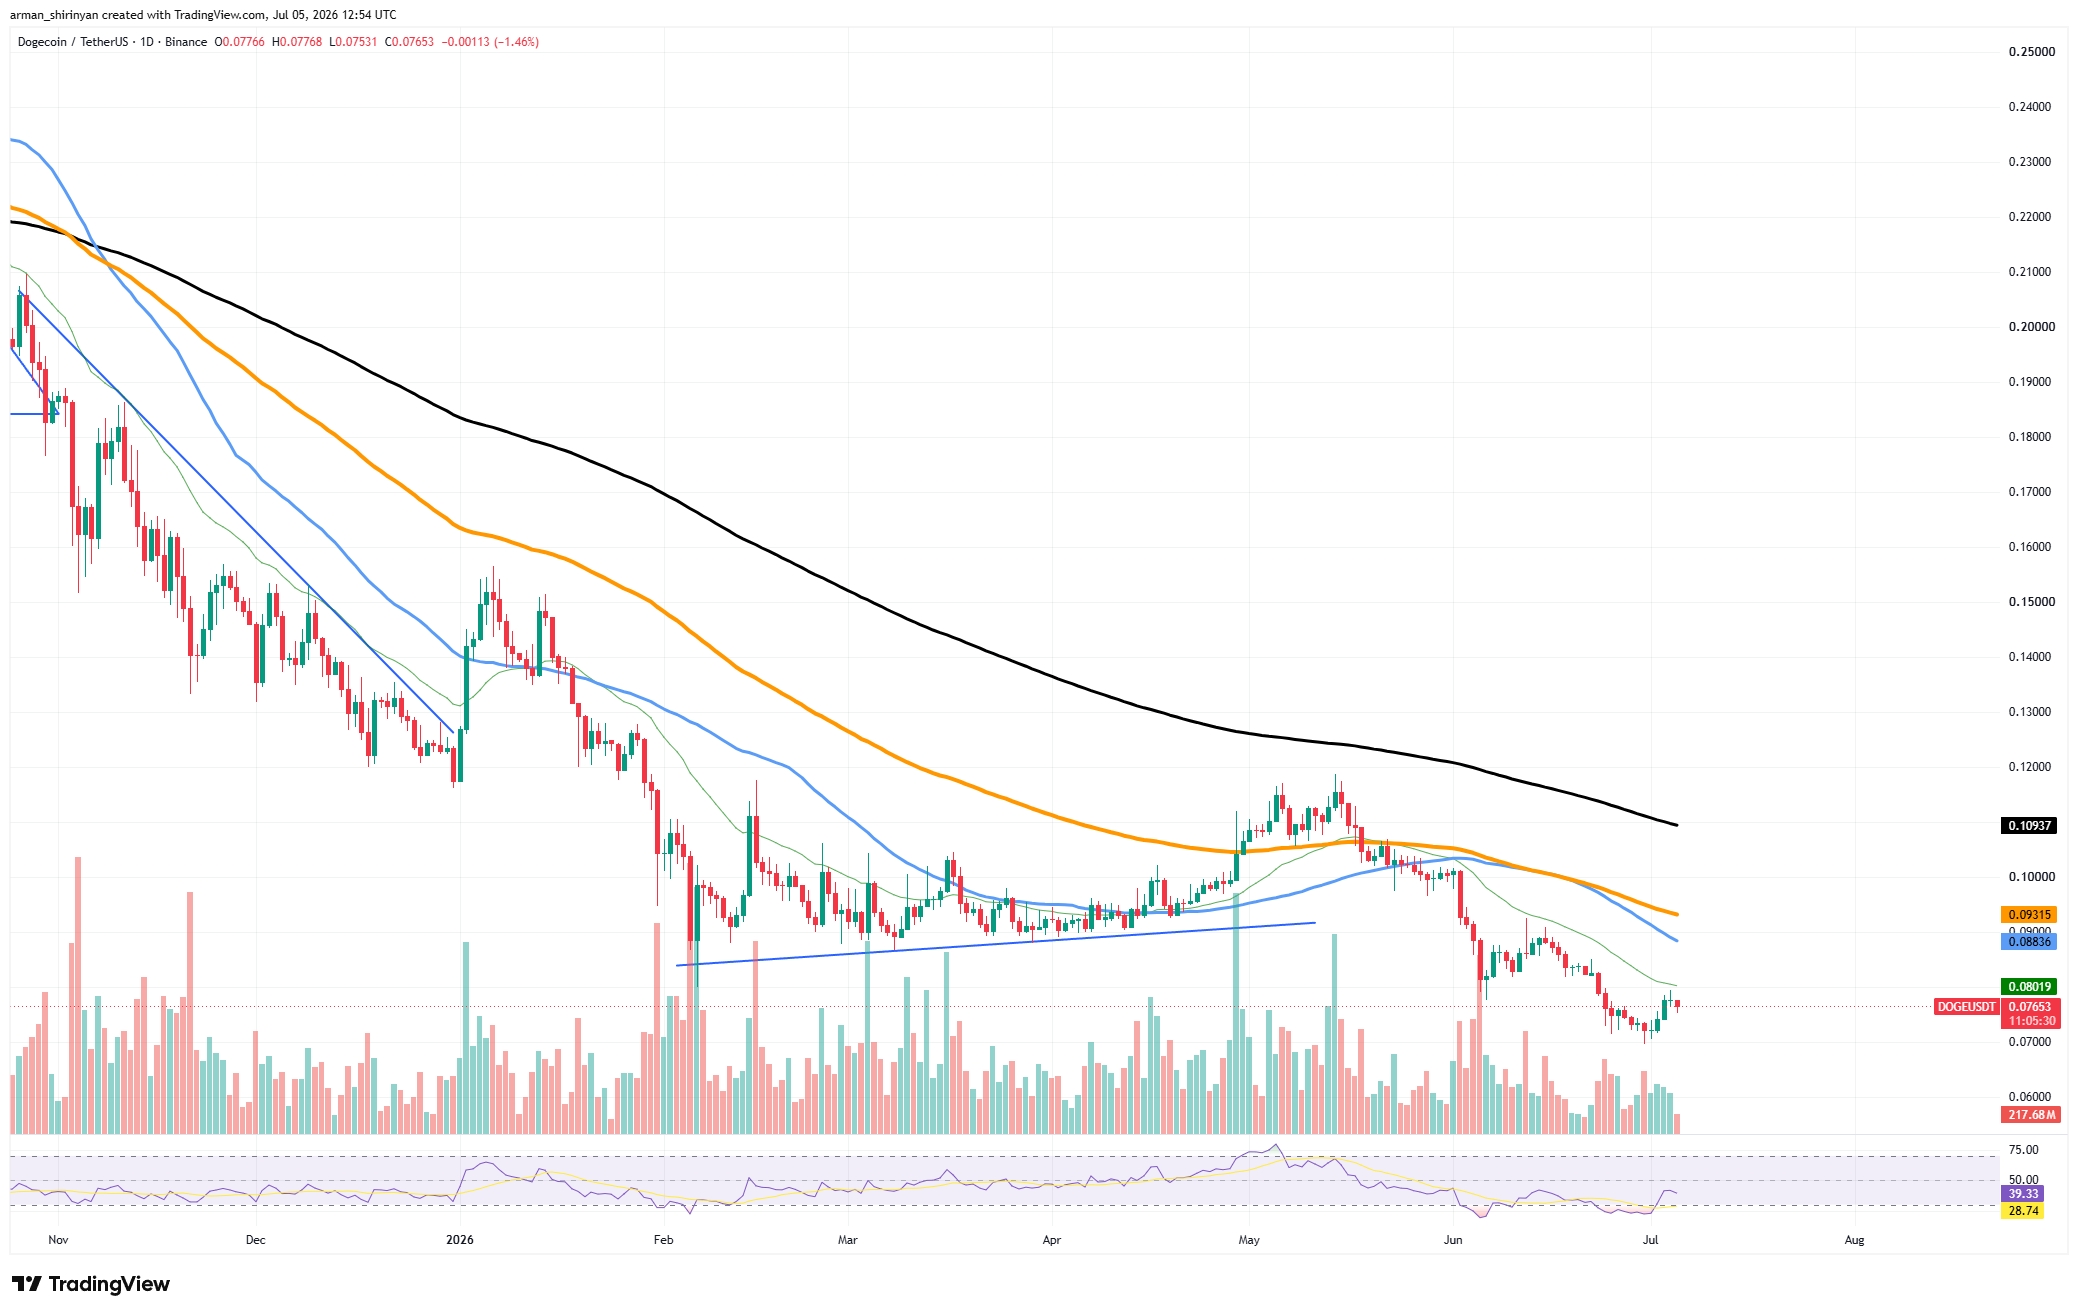
The fact that Dogecoin is still below all of the major moving averages presents a challenge for bulls. The longer-term trend is still negative, as evidenced by the 50-day EMA near $0.088 and the 100-day EMA near $0.095, which both continue to slope downward. Oversold conditions, which frequently precede relief rallies, have begun to improve for the RSI.
The indicator is getting closer to the neutral zone, indicating a short-term loss of control for sellers. Additionally, during the most recent rebound, volume has somewhat improved, lending the move more legitimacy. The first significant level of resistance is located between $0.080 and $0.088.
The psychological $0.10 level is probably the next target if DOGE is successful in regaining that area. After months of weakness, sentiment would considerably improve with such a move. On the downside, DOGE may return to the recent support level at $0.070 if momentum is lost. Dogecoin still needs a clear breakout above its moving averages before a sustainable trend reversal can be verified, even though the current bounce is encouraging.
