


TLDR
- DOGE is compressing inside a long-term pennant structure with lower highs and higher lows converging toward the apex.
- The market cap chart shows a similar triangle closing in on a descending resistance line, with a possible target of $73.19 billion if broken.
- DOGE is retesting the 0.618 Fibonacci fan level, mirroring the 0.5 Fib fan retest that preceded the October 2024 rally to $0.48.
- Key support sits at $0.095; a weekly close below that level would weaken the current bullish pattern.
- Analyst Trader Tardigrade points to historical accumulation cycles in 2015, 2019, and 2025 as evidence DOGE may be in a pre-rally phase.
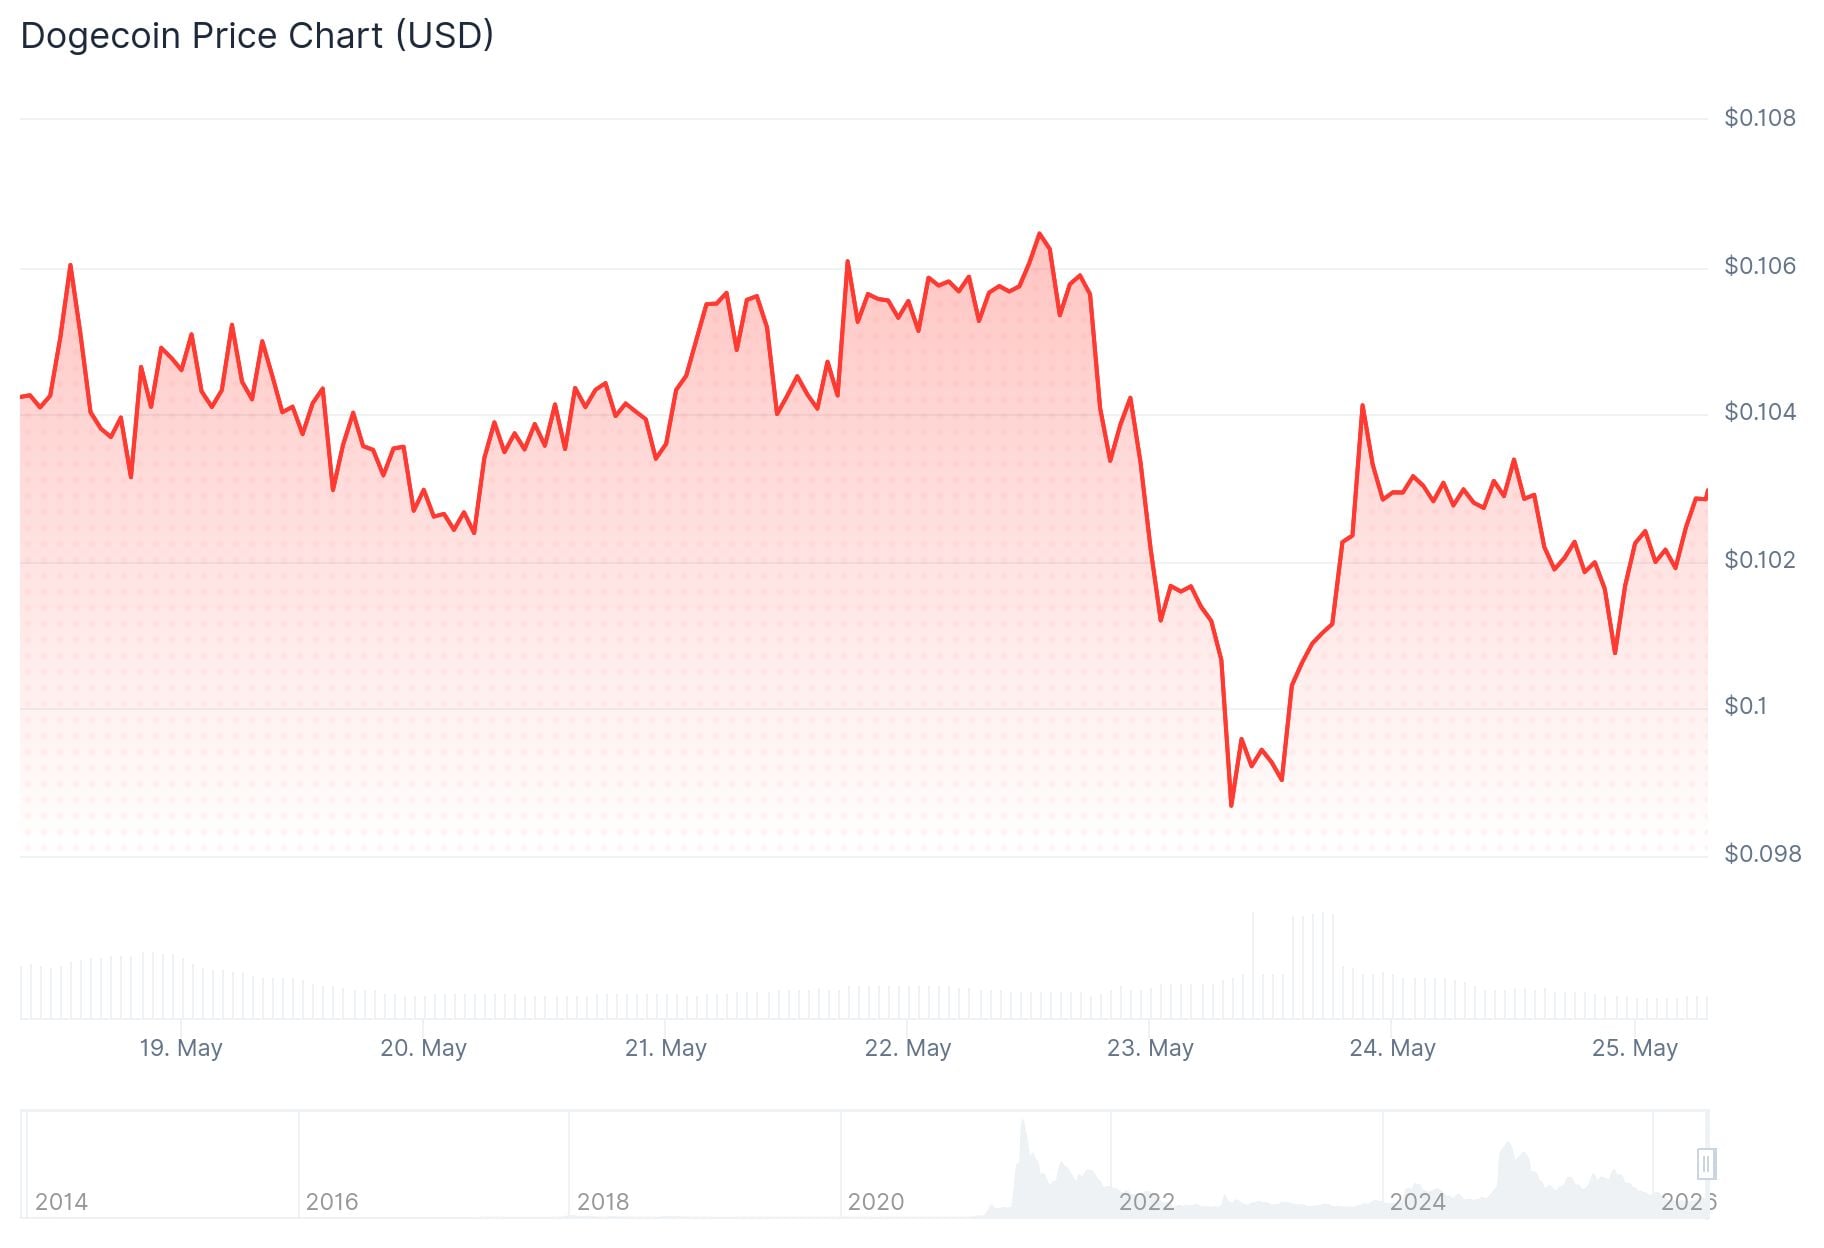
Dogecoin (DOGE) is sitting at a technical crossroads. The price is currently around $0.1028, caught inside two overlapping compression patterns that analysts say could determine the next major move.
The first pattern is a long-term pennant on the price chart. Shared by analyst Bitcoinsensus on X, the chart shows DOGE forming lower highs and higher lows since its post-rally peak. This creates a narrowing triangle where price is getting squeezed toward the apex.
$DOGE FORMING A LARGE PENNANT STRUCTURE 🚨
DOGE is compressing inside a long-term pennant after its major impulse move#DOGE #Crypto #Memecoin pic.twitter.com/wWUd05eVPV
— Bitcoinsensus (@Bitcoinsensus) May 24, 2026
The upper trendline of this pennant has acted as resistance multiple times. Each time buyers have pushed toward it, sellers have held the line. The lower trendline, meanwhile, has served as rising support since the 2022 low, and DOGE has held it on several occasions.
No breakout has been confirmed yet. Until DOGE posts a strong candle above the upper resistance line, the price may continue moving sideways inside the narrowing range.
Market Cap Chart Tells a Similar Story
The pattern repeats when looking at the Dogecoin market cap. Analyst DonWedge shared a chart showing the market cap compressing inside its own long-term triangle, closing in on the apex formed by a descending resistance line from the 2021 peak and a rising support line.
A clean break above the yellow resistance zone on the market cap chart could open the door toward a $73.19 billion target, according to the chart. Current market cap sits well below that level. The key risk remains the lower purple trendline. If market cap falls below that support, the compression setup loses credibility.

DOGE is not yet signaling a breakout on either chart.
Fibonacci Fan Mirrors 2024 Breakout Setup
A separate analysis, using a Fibonacci fan drawn from the 2021 all-time high of $0.7316, highlights a potential repeat of the October 2024 pattern. Back then, DOGE retested the 0.5 Fib fan level, held it, and then rallied to $0.48 by December 2024.
dogecoin:native
Oct 2024 retest of the 0.5 Fib fan preceded the big wave.
Similar setup now playing out at the 0.618 Fib fan.
Ocean patterns repeating? pic.twitter.com/3G1vGZxSzN
— Surf (@_CryptoSurf) May 20, 2026
Now, the chart shows DOGE testing the 0.618 Fib fan in the $0.10 to $0.11 range. Analyst @_CryptoSurf on X flagged this setup on TradingView.
For the pattern to play out, bulls would need to hold $0.095 on a weekly close and push above $0.115, followed by a move back above $0.14. A weekly close below $0.095 would instead point toward a consolidation range between $0.095 and $0.08.
Analyst Trader Tardigrade (TATrader_Alan) weighed in on the DOGE monthly chart, arguing that 2025-2026 mirrors prior accumulation phases seen in 2015-2017 and 2019-2020, both of which preceded large rallies. He called the current period “the best accumulation period” and noted that every previous DOGE accumulation zone ended with a parabolic move.
$Doge/monthly
This is the window 🚀#Dogecoin is still in the best accumulation period — and history proves exactly what happens next.
Every single time $DOGE entered an accumulation zone, it consolidated sideways before exploding into a parabolic rally.
2015-2017:… pic.twitter.com/AYzZI8nBoQ
— Trader Tardigrade 🧬 (@TATrader_Alan) May 23, 2026
At the time of writing, Dogecoin is trading at $0.1028.

