

TLDR
- SOL is trading near $84, down 2.35% over the past week, with a market cap of $48.45 billion.
- Solana leads all Layer 1 and Layer 2 networks in DApp revenue and DEX volume.
- Open interest rose slightly to $4.84B, but trading volume dropped 26.79%, pointing to cautious sentiment.
- SOL faces resistance at $88.77 and support at $81.94, with MACD showing weak momentum.
- Analyst CryptoJack flagged next week as a key decision point for whether SOL breaks its trendline or gets rejected.
Solana is holding near $84 after a sharp decline from its February high of $140. The token has settled into a tight trading range as the market waits for a clearer direction.
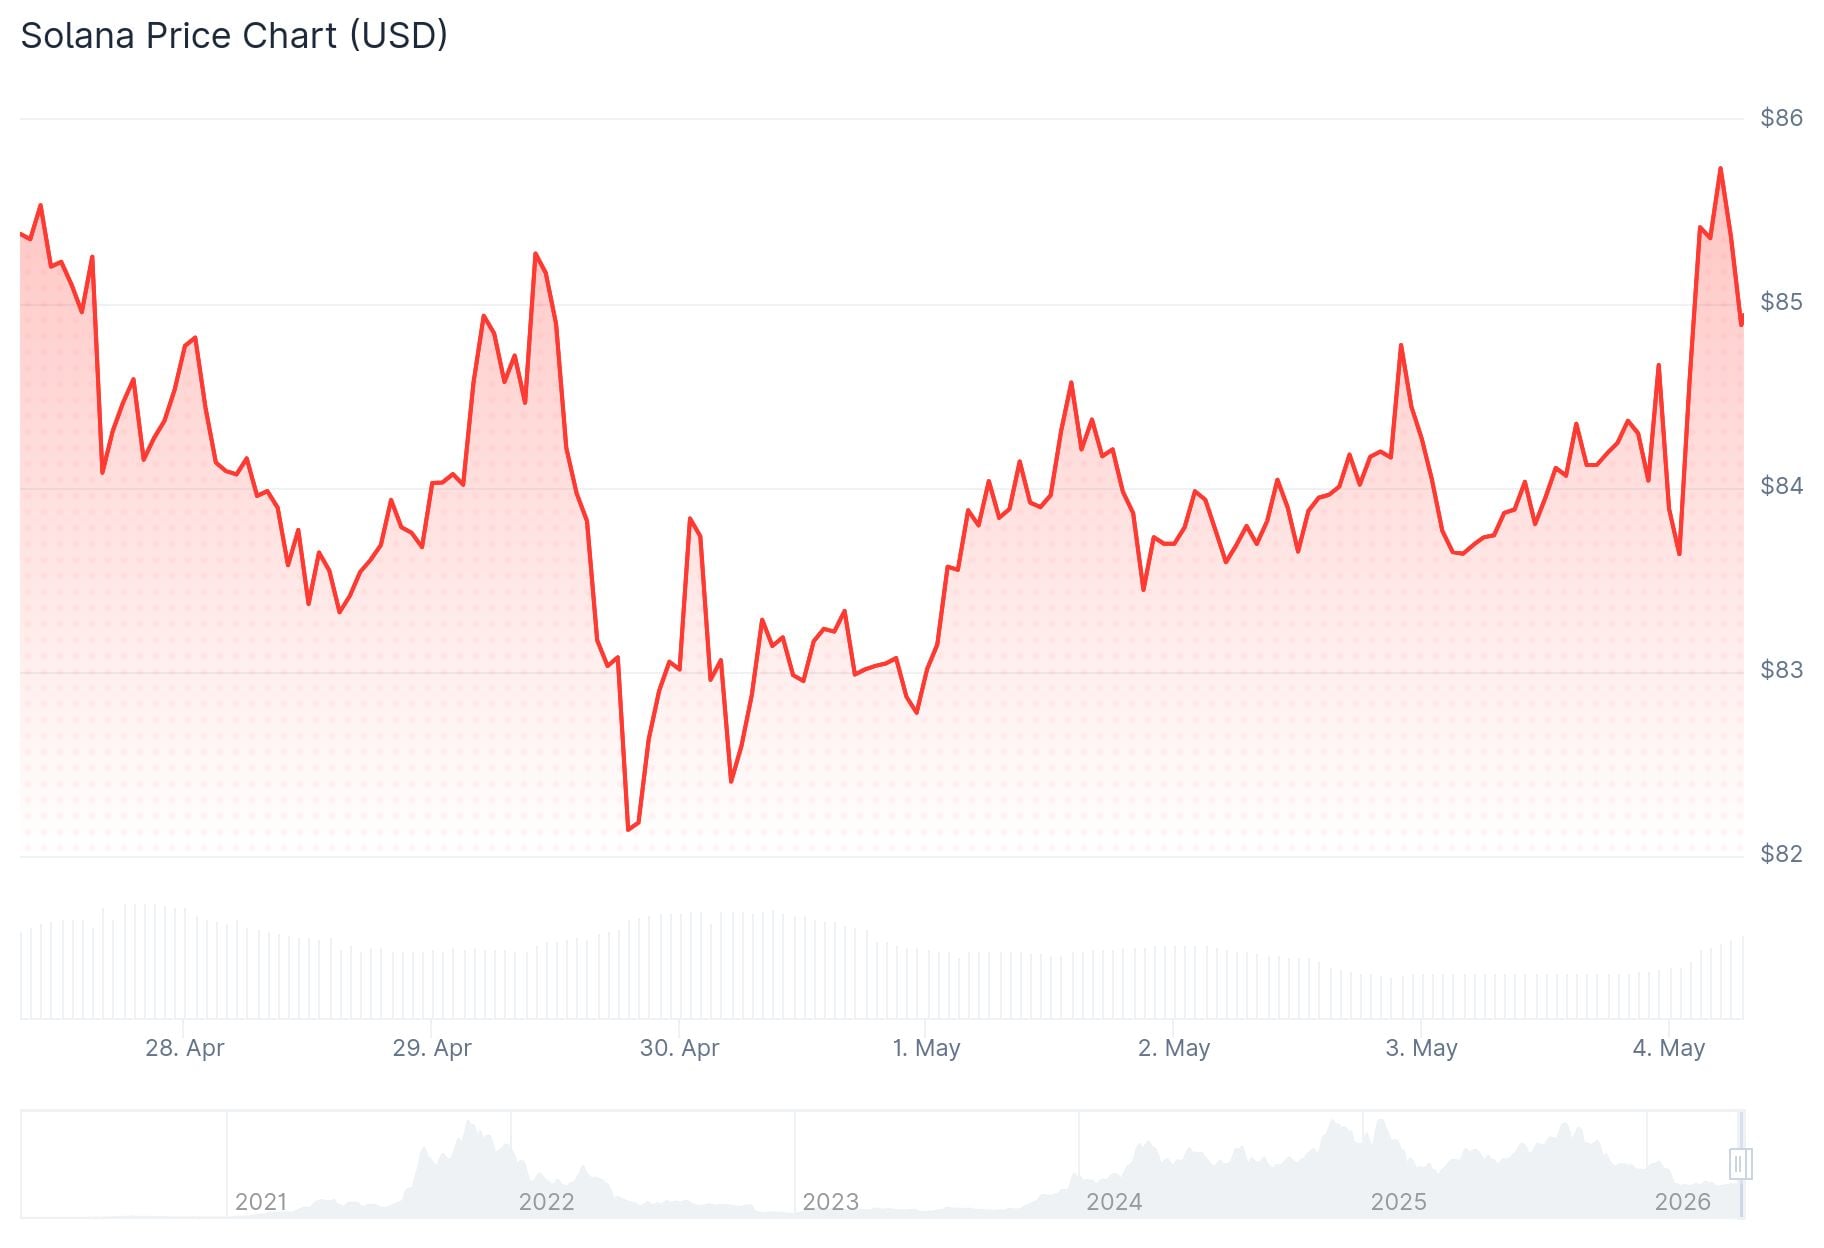
According to CoinMarketCap, SOL is priced at $84.07 with a 24-hour trading volume of $2.41 billion and a market cap of $48.45 billion. The price is down 2.35% over the past seven days.
Buyers have stepped in around the $82 to $83 zone, which has acted as a short-term floor. Analyst BitGuru flagged this area as a key technical level on May 1, noting that bulls need strong spot demand to hold it, not just short-term leverage moves.
Crypto analyst CryptoJack posted a direct question to followers: “Will it break the trendline and hold above it? Or get rejected at resistance and move lower?” — framing next week as a defining moment for SOL’s near-term direction.
🚨 NEXT WEEK WILL DECIDE $SOL’S DIRECTION 🚨
Will it break the trendline and hold above it?
Or get rejected at resistance and move lower?Stay alert. 👀 pic.twitter.com/ygEG7rvD5e
— CryptoJack (@cryptojack) May 3, 2026
On-Chain Activity Remains a Bright Spot
Despite the flat price action, Solana’s network continues to perform well. Data from Solana Floor shows the chain leads both Layer 1 and Layer 2 networks in daily and weekly DApp revenue and DEX trading volume.
UPDATE: @Solana continues to surpass all L1 and L2 chains in daily and weekly DApp revenue and DEX volume. pic.twitter.com/asyEgsru9S
— SolanaFloor (@SolanaFloor) May 3, 2026

Low transaction fees and fast settlement times are driving high-frequency trading and DeFi activity. This keeps Solana competitive in on-chain metrics even while its price remains in a holding pattern.
Derivatives and Technical Picture
On the derivatives side, open interest edged up 0.09% to $4.84 billion, while volume fell 26.79% to $4.45 billion. Coinglass data shows a slightly negative OI-weighted funding rate of -0.0073%, pointing to mild bearish sentiment among futures traders.
$SOL had a strong push, then moved into consolidation, and now it’s sitting near a reversal zone. Price is holding support but still weak below 88 resistance. pic.twitter.com/kR6myIFZUz
— BitGuru 🔶 (@bitgu_ru) May 3, 2026
Solana is trading below its 20-day simple moving average, and the MACD is converging near zero with little momentum. Resistance sits at $88.77, with support at $81.94.
A liquidation heatmap shows short positions clustered between $84 and $87. A push into that zone could trigger forced exits, but follow-through above $88 to $90 is needed to confirm anything meaningful.
ETF data adds to the cautious picture. SOLZ saw a $585,473 outflow on May 1. April inflows across Solana ETFs totaled just $38.7 million — the smallest monthly figure to date, despite cumulative inflows near $1 billion.
The Bitwise Solana Staking ETF (BSOL) was an exception, pulling in $6.2 million on April 24, equal to roughly 1% of its $611.8 million in assets under management.
SOL needs to reclaim $106.24 before any broader bullish momentum can take hold. For now, the token remains between defended support and heavy resistance.
